롱
BitShares BTSBTC - Long Setup D1
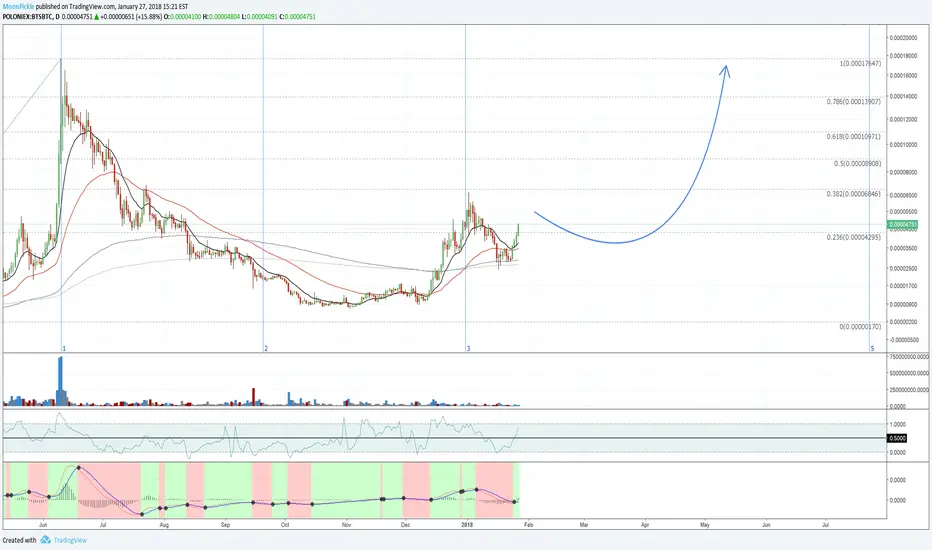
Use fib lines as targets - both time and price analysis are available on the chart.
Measure fib zone 1 to fib zone 2 to determine a time estimate for the formation on the right side of the cup chart pattern within fib zone 3 to fib zone 5.
RSI shows plenty of action on the upper +50 range, indicating bullish bias.
MACD shows fresh momentum.
No volume divergence.
Double bottom pattern shows minor correction is done.
EMA bounce up, no cross.
READY TO GO.
Measure fib zone 1 to fib zone 2 to determine a time estimate for the formation on the right side of the cup chart pattern within fib zone 3 to fib zone 5.
RSI shows plenty of action on the upper +50 range, indicating bullish bias.
MACD shows fresh momentum.
No volume divergence.
Double bottom pattern shows minor correction is done.
EMA bounce up, no cross.
READY TO GO.
액티브 트레이드
노트
buy the break out, when price action leaves/breaks the downward channel (moving up)노트
leaving the buy box노트
BOOM노트
fractals on 4H노트
btc correction took bts with it, a double bottom has appeared on 4H주문취소됨
btc
면책사항
해당 정보와 게시물은 금융, 투자, 트레이딩 또는 기타 유형의 조언이나 권장 사항으로 간주되지 않으며, 트레이딩뷰에서 제공하거나 보증하는 것이 아닙니다. 자세한 내용은 이용 약관을 참조하세요.
면책사항
해당 정보와 게시물은 금융, 투자, 트레이딩 또는 기타 유형의 조언이나 권장 사항으로 간주되지 않으며, 트레이딩뷰에서 제공하거나 보증하는 것이 아닙니다. 자세한 내용은 이용 약관을 참조하세요.