롱
Feeling Divergent?
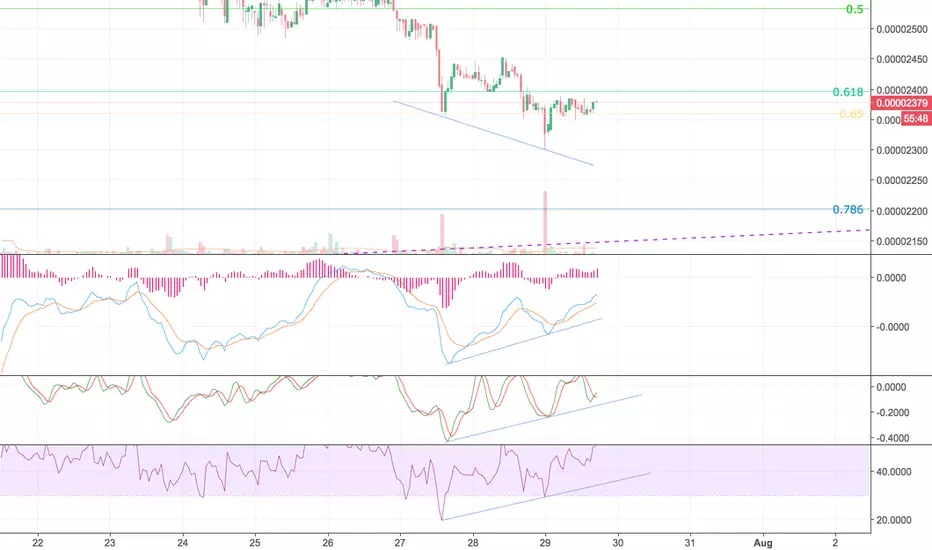
Bitshares to Bitcoin is racking up one bullish signal after another! Today we're seeing a nice divergence on the 1-hour chart, indicating trend reversal around the corner: trend line connecting lower lows is descending, but the MACD, RSI and RVGI are all putting in higher lows.
As always, there's never security in TA, but the list of bullish signals is getting longer day-by-day, and by taking so long the long term support trend line is creeping up as well, which is a good thing since it means the "bottom" is going higher and higher.
By the way, that long term support is now around 2150 sats and moving up. It's on my chart in dashed purple if you zoom the value scale a bit.
As always, there's never security in TA, but the list of bullish signals is getting longer day-by-day, and by taking so long the long term support trend line is creeping up as well, which is a good thing since it means the "bottom" is going higher and higher.
By the way, that long term support is now around 2150 sats and moving up. It's on my chart in dashed purple if you zoom the value scale a bit.

면책사항
해당 정보와 게시물은 금융, 투자, 트레이딩 또는 기타 유형의 조언이나 권장 사항으로 간주되지 않으며, 트레이딩뷰에서 제공하거나 보증하는 것이 아닙니다. 자세한 내용은 이용 약관을 참조하세요.
면책사항
해당 정보와 게시물은 금융, 투자, 트레이딩 또는 기타 유형의 조언이나 권장 사항으로 간주되지 않으며, 트레이딩뷰에서 제공하거나 보증하는 것이 아닙니다. 자세한 내용은 이용 약관을 참조하세요.