Long
BTTUSDT Long position
Hello Everyone.
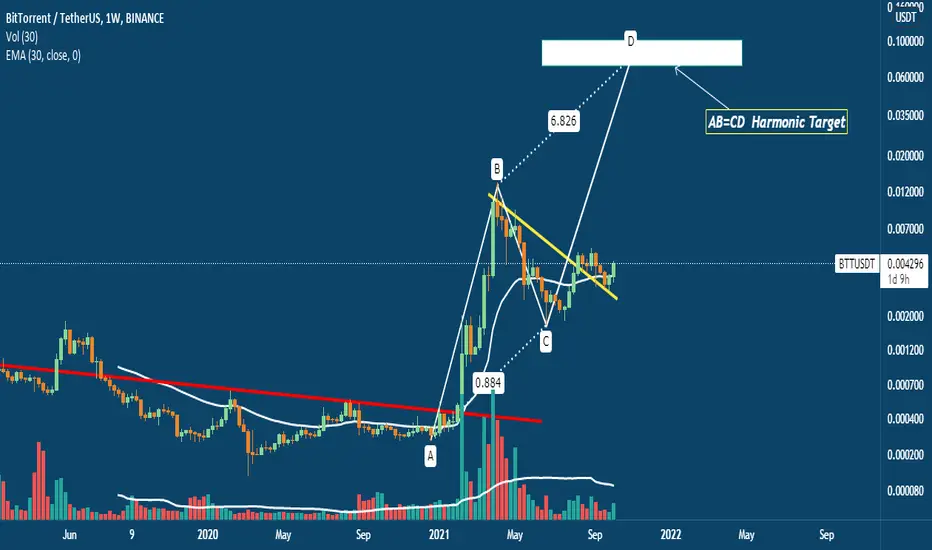
This crypto has an interesting chart. After breaking resistance line, which is indicated by red line, it started to form an AB=CD Harmonic pattern. As it has been seen, it reversed after touching 61.8% Fibonacci level, which assured us that this chart might form a AB=CD harmonic pattern. It is going to go up after completing pullback to the braked resistance line, so it might complete AB=CD pattern for a long term trading position.
$BINANCE:BTTUSDT
This crypto has an interesting chart. After breaking resistance line, which is indicated by red line, it started to form an AB=CD Harmonic pattern. As it has been seen, it reversed after touching 61.8% Fibonacci level, which assured us that this chart might form a AB=CD harmonic pattern. It is going to go up after completing pullback to the braked resistance line, so it might complete AB=CD pattern for a long term trading position.
$BINANCE:BTTUSDT

면책사항
해당 정보와 게시물은 금융, 투자, 트레이딩 또는 기타 유형의 조언이나 권장 사항으로 간주되지 않으며, 트레이딩뷰에서 제공하거나 보증하는 것이 아닙니다. 자세한 내용은 이용 약관을 참조하세요.
면책사항
해당 정보와 게시물은 금융, 투자, 트레이딩 또는 기타 유형의 조언이나 권장 사항으로 간주되지 않으며, 트레이딩뷰에서 제공하거나 보증하는 것이 아닙니다. 자세한 내용은 이용 약관을 참조하세요.