

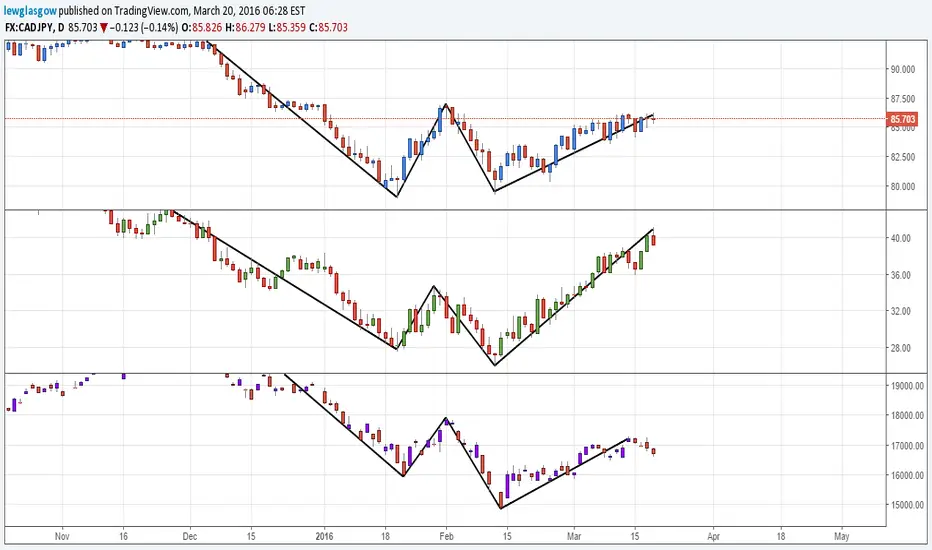
These moves are not measured, they are simply displayed to show the correlation between each market. The charts shown are listed below:
Top: CAD/JPY on a Daily chart
Middle: USOIL on a Daily chart
Bottom: NKY on a Daily chart
Additional: The same pattern can be found on multiple charts and markets, including SU and HSE. The weekly crude oil inventory report will be released on March 23rd.
I can see the Japanese Yen gaining strength, comparing other currency pairs such as GBP/JPY and EUR/JPY paints a picture for direction. In addition there is always a fear for crude oil at around 40, this chart relates heavily to my idea posted on crude oil earlier this week, taking the formation of a bullish 5-0. You can view this in the link below!
Feel free to leave any additional analysis on this idea.

📈 Master the Art and Science of Trading: sixfigurecapital.com
관련 발행물
면책사항
해당 정보와 게시물은 금융, 투자, 트레이딩 또는 기타 유형의 조언이나 권장 사항으로 간주되지 않으며, 트레이딩뷰에서 제공하거나 보증하는 것이 아닙니다. 자세한 내용은 이용 약관을 참조하세요.
📈 Master the Art and Science of Trading: sixfigurecapital.com
관련 발행물
면책사항
해당 정보와 게시물은 금융, 투자, 트레이딩 또는 기타 유형의 조언이나 권장 사항으로 간주되지 않으며, 트레이딩뷰에서 제공하거나 보증하는 것이 아닙니다. 자세한 내용은 이용 약관을 참조하세요.