

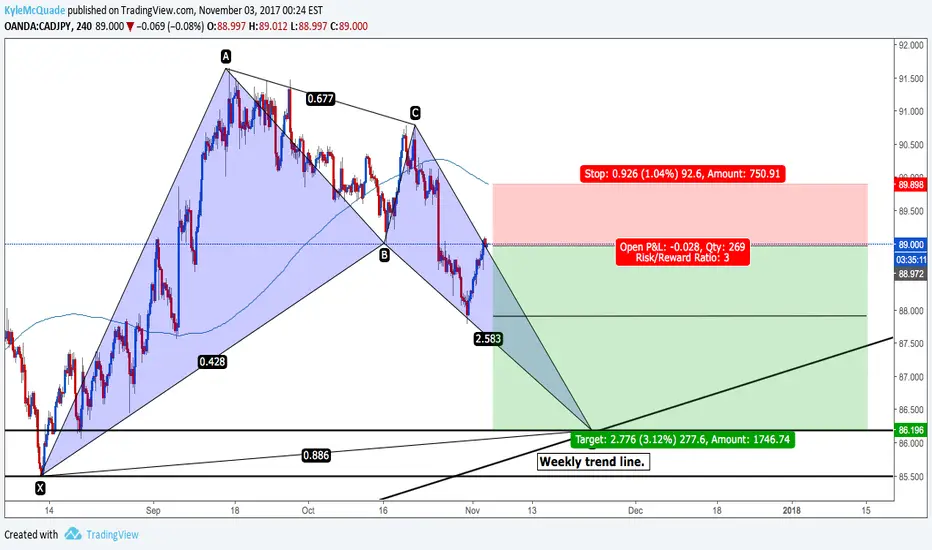
CADJPY has began to pivot around the neckline of a head and shoulders on the daily/weekly chart. Price found support at this level on the 4 hour chart, made a new low and is now retesting the previous los as resistance. Recent dips and rallies have been urgent and direct in recent weeks, however price dropping below the 4HR 200EMA at this neckline gives a sign that we should see some consolidation before another fluctuation.
Risk is 1:3 in this case because we are testing the resistance, as opposed to trading the breakout (I wanted to see if price would break first, in case it continued north after breaking the H&S neckline).
Head and shoulders can be seen below, along with previous support/resistance.
Risk is 1:3 in this case because we are testing the resistance, as opposed to trading the breakout (I wanted to see if price would break first, in case it continued north after breaking the H&S neckline).
Head and shoulders can be seen below, along with previous support/resistance.
노트
Here is my overview for this pair.노트
I believe price will be good to short at the break of this small trend line!노트
1st take profit level was reached, position re-entered at this level with half a position size.
관련 발행물
면책사항
해당 정보와 게시물은 금융, 투자, 트레이딩 또는 기타 유형의 조언이나 권장 사항으로 간주되지 않으며, 트레이딩뷰에서 제공하거나 보증하는 것이 아닙니다. 자세한 내용은 이용 약관을 참조하세요.
면책사항
해당 정보와 게시물은 금융, 투자, 트레이딩 또는 기타 유형의 조언이나 권장 사항으로 간주되지 않으며, 트레이딩뷰에서 제공하거나 보증하는 것이 아닙니다. 자세한 내용은 이용 약관을 참조하세요.