
📊 Current Context (Weekly Frame)
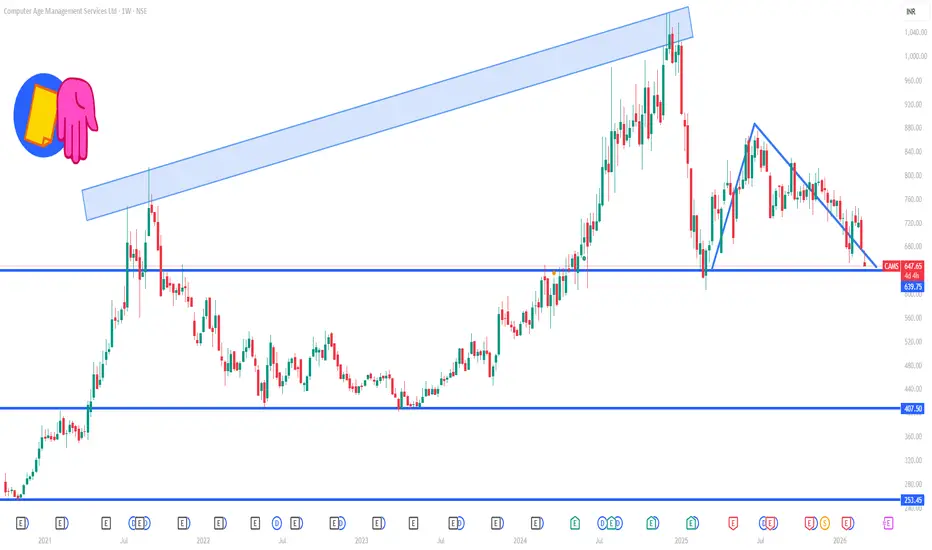
The stock recently traded around ~₹650–₹680 on NSE, and has been moving lower in the short term on the weekly chart.
Weekly momentum signals have been negative/bearish, with downside movement dominating.
🧭 Weekly Support Levels
Key support zones to watch on a 1-week timeframe:
~₹650–₹660 — nearest support range where recent lows cluster.
~₹630–₹640 — secondary support buffer if the first level is broken (close to the lower side of the most recent weekly range).
~₹606 — 52-week low boundary, major structural support zone.
A weekly close below ₹650 could tilt the short term tone more bearish.
🔝 Weekly Resistance Levels
Key resistance zones on weekly time frame:
~₹690–₹700 — first resistance on weekly bounce attempts (near recent swing highs).
~₹710–₹720 — psychological supply zone and near short-term pivot region.
~₹740–₹750 — higher resistance belt defined by prior weekly pivots and range tops.
A sustained weekly close above ~₹700-₹710 would be needed to suggest a recovery bias.
📌 Weekly Pivot / Mid Levels (Indicative)
Weekly pivot approx: ~₹690–₹700 zone (short-term equilibrium).
Price above pivot → weekly bullish bias; below pivot → weekly bearish bias.
The stock recently traded around ~₹650–₹680 on NSE, and has been moving lower in the short term on the weekly chart.
Weekly momentum signals have been negative/bearish, with downside movement dominating.
🧭 Weekly Support Levels
Key support zones to watch on a 1-week timeframe:
~₹650–₹660 — nearest support range where recent lows cluster.
~₹630–₹640 — secondary support buffer if the first level is broken (close to the lower side of the most recent weekly range).
~₹606 — 52-week low boundary, major structural support zone.
A weekly close below ₹650 could tilt the short term tone more bearish.
🔝 Weekly Resistance Levels
Key resistance zones on weekly time frame:
~₹690–₹700 — first resistance on weekly bounce attempts (near recent swing highs).
~₹710–₹720 — psychological supply zone and near short-term pivot region.
~₹740–₹750 — higher resistance belt defined by prior weekly pivots and range tops.
A sustained weekly close above ~₹700-₹710 would be needed to suggest a recovery bias.
📌 Weekly Pivot / Mid Levels (Indicative)
Weekly pivot approx: ~₹690–₹700 zone (short-term equilibrium).
Price above pivot → weekly bullish bias; below pivot → weekly bearish bias.

Contact Knowledgehub for a detailed consultation: Dm on WhatsApp: [wa.link/a2o0kz]-
Phone No: [+91 93102 26243]-
Email: [tradingviewknowledgehub@gmail.com]---
-- Let’s achieve success together!
Phone No: [+91 93102 26243]-
Email: [tradingviewknowledgehub@gmail.com]---
-- Let’s achieve success together!
관련 발행물
면책사항
해당 정보와 게시물은 금융, 투자, 트레이딩 또는 기타 유형의 조언이나 권장 사항으로 간주되지 않으며, 트레이딩뷰에서 제공하거나 보증하는 것이 아닙니다. 자세한 내용은 이용 약관을 참조하세요.
Contact Knowledgehub for a detailed consultation: Dm on WhatsApp: [wa.link/a2o0kz]-
Phone No: [+91 93102 26243]-
Email: [tradingviewknowledgehub@gmail.com]---
-- Let’s achieve success together!
Phone No: [+91 93102 26243]-
Email: [tradingviewknowledgehub@gmail.com]---
-- Let’s achieve success together!
관련 발행물
면책사항
해당 정보와 게시물은 금융, 투자, 트레이딩 또는 기타 유형의 조언이나 권장 사항으로 간주되지 않으며, 트레이딩뷰에서 제공하거나 보증하는 것이 아닙니다. 자세한 내용은 이용 약관을 참조하세요.