롱
Cannabiscoin feuling up
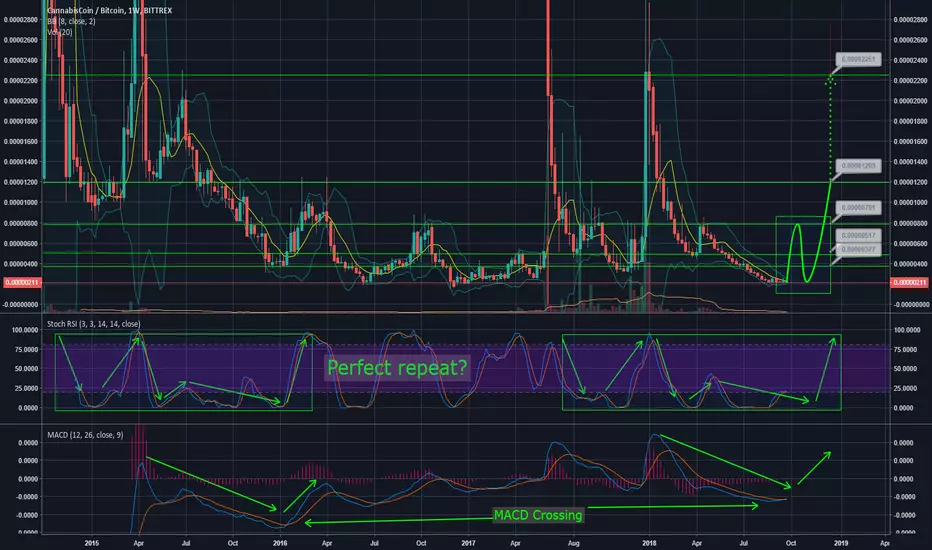
Just started looking at the weekly view and found a repeating pattern in the YTD chart of CANN.
Indicators
Fact
Chart is weekly view, have to give this trade some time to develop.
My Targets:
Mid term
- 377 Sat
- 517 Sat
- 791 Sat
When we look at the history of this coin, big pumps happen, targets (risky) here are:
- 1203
- 2270
- Up to 4500
This is no advice, just my tradesetup an why! DYOR and good luck!
Indicators
- MACD is rising and ready to cross on the weekly chart.
- RSI is making a repeating move to, you can see the repeating pattern in the green rectangles.
Fact
Chart is weekly view, have to give this trade some time to develop.
My Targets:
Mid term
- 377 Sat
- 517 Sat
- 791 Sat
When we look at the history of this coin, big pumps happen, targets (risky) here are:
- 1203
- 2270
- Up to 4500
This is no advice, just my tradesetup an why! DYOR and good luck!

면책사항
해당 정보와 게시물은 금융, 투자, 트레이딩 또는 기타 유형의 조언이나 권장 사항으로 간주되지 않으며, 트레이딩뷰에서 제공하거나 보증하는 것이 아닙니다. 자세한 내용은 이용 약관을 참조하세요.
면책사항
해당 정보와 게시물은 금융, 투자, 트레이딩 또는 기타 유형의 조언이나 권장 사항으로 간주되지 않으며, 트레이딩뷰에서 제공하거나 보증하는 것이 아닙니다. 자세한 내용은 이용 약관을 참조하세요.