롱
CCCS - Buy
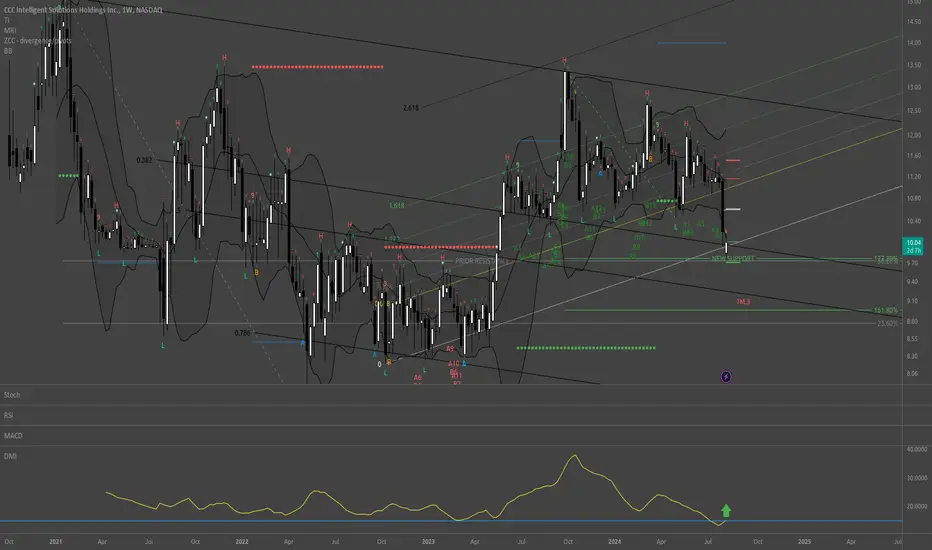
I used TradingView's stock screener to find assets with ADX (14) crossing up 15 on Weekly charts and came upon this CCCS. All of this analysis is based on a Weekly chart. First and foremost this is the first time that ADX is crossing up 15 in the chart's history. Secondly, TD Sequential is on 8/9 of a Buy signal. Third, it's at the bottom of the Bollinger Band. Fourthly, it's at Fibonacci Pivots S2. Lastly, this exact spot is a convergence of several Fibonacci support levels. This looks like the bottom of a coming up trend.
38.20% pullback into Monthly Fibonacci Pivots S2:

38.20% pullback:

127.20% extension support:

Uptrend neared 2.618% extension:

ADX crossing up 15 first time in stock's history:

Bollinger Band lower band:

38.20% pullback into Monthly Fibonacci Pivots S2:
38.20% pullback:
127.20% extension support:
Uptrend neared 2.618% extension:
ADX crossing up 15 first time in stock's history:
Bollinger Band lower band:

관련 발행물
면책사항
해당 정보와 게시물은 금융, 투자, 트레이딩 또는 기타 유형의 조언이나 권장 사항으로 간주되지 않으며, 트레이딩뷰에서 제공하거나 보증하는 것이 아닙니다. 자세한 내용은 이용 약관을 참조하세요.
면책사항
해당 정보와 게시물은 금융, 투자, 트레이딩 또는 기타 유형의 조언이나 권장 사항으로 간주되지 않으며, 트레이딩뷰에서 제공하거나 보증하는 것이 아닙니다. 자세한 내용은 이용 약관을 참조하세요.