
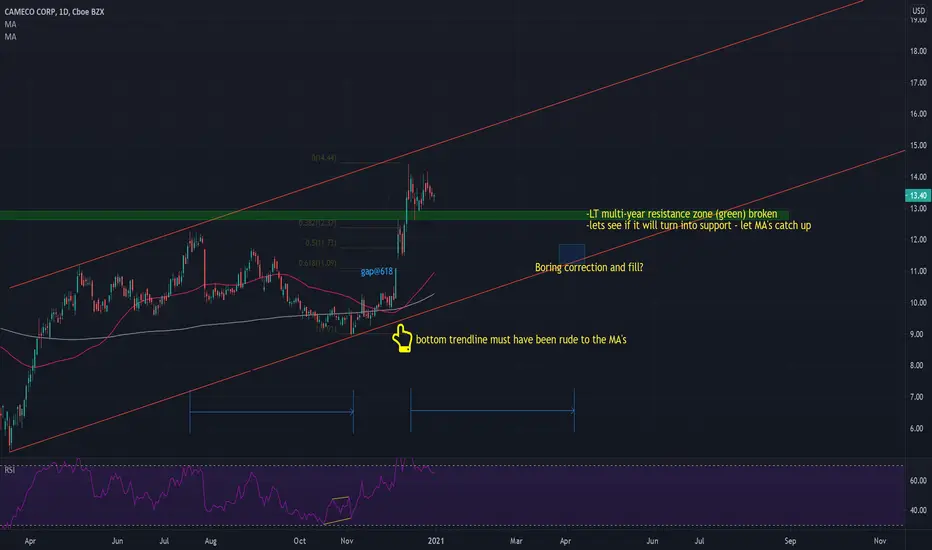
Above it, followed by retest and resumption, will result in a parabolic move.
Still has that gap to fill, will result in some soiled underwear if it were to happen rapidly. Flagging out until April.... boring but... w/e
I haven't been charting for very long, but let me know if my comments below are stupid.
CCJ Daily Chart Divergences usually lead to a LT trend. (I'm very intrigued by this... when I find a stock that behaves like this)
2000: May-August. See the divergences and all three trending upward, especailly in July
2002: Summer to Fall. MACD like a slingshot, RSI ascending lows contradicting the two valleys in the candles
2010-2011: RSI and MACD pulling on the candles between November 10' and Feb 11' but specifically RSI and STOCH early FEb to Mid Feb. Then fundamentals kicked in: earthquake.
2020: Mid Oct to Early Nov (this is the divergence that I think sent CCJ up the channel for a long time)
Still learning.
Still has that gap to fill, will result in some soiled underwear if it were to happen rapidly. Flagging out until April.... boring but... w/e
I haven't been charting for very long, but let me know if my comments below are stupid.
CCJ Daily Chart Divergences usually lead to a LT trend. (I'm very intrigued by this... when I find a stock that behaves like this)
2000: May-August. See the divergences and all three trending upward, especailly in July
2002: Summer to Fall. MACD like a slingshot, RSI ascending lows contradicting the two valleys in the candles
2010-2011: RSI and MACD pulling on the candles between November 10' and Feb 11' but specifically RSI and STOCH early FEb to Mid Feb. Then fundamentals kicked in: earthquake.
2020: Mid Oct to Early Nov (this is the divergence that I think sent CCJ up the channel for a long time)
Still learning.

면책사항
해당 정보와 게시물은 금융, 투자, 트레이딩 또는 기타 유형의 조언이나 권장 사항으로 간주되지 않으며, 트레이딩뷰에서 제공하거나 보증하는 것이 아닙니다. 자세한 내용은 이용 약관을 참조하세요.
면책사항
해당 정보와 게시물은 금융, 투자, 트레이딩 또는 기타 유형의 조언이나 권장 사항으로 간주되지 않으며, 트레이딩뷰에서 제공하거나 보증하는 것이 아닙니다. 자세한 내용은 이용 약관을 참조하세요.