
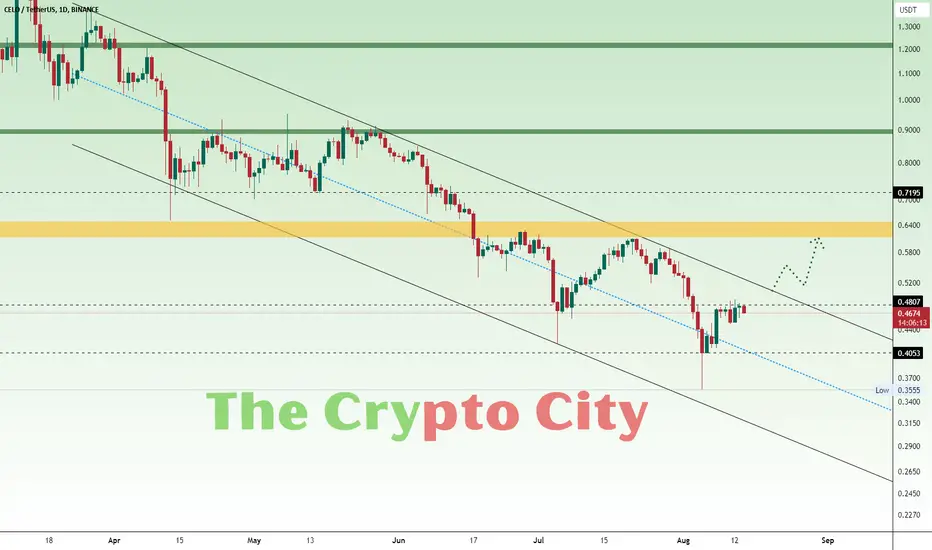
CELO is currently in a bearish trend and has been moving within a descending channel for approximately 141 days. The chart clearly shows the price making lower highs and lower lows, respecting the boundaries of this channel.
At the moment, the price is positioned near a critical juncture where it could potentially break out of this descending channel, signaling a reversal. For a bullish move to occur, CELO must break above the channel’s upper boundary. This resistance has acted as a barrier to the price, preventing any significant upward movement.
On the other hand, if the price fails to break this resistance and continues downward, it is likely to test the lower support of the descending channel.
Traders should monitor the price action closely, especially looking for a breakout above the descending channel, which would be a strong indicator of a potential bullish reversal. An increase in trading volume would provide further confirmation of this move.
Everything is on the chart.
At the moment, the price is positioned near a critical juncture where it could potentially break out of this descending channel, signaling a reversal. For a bullish move to occur, CELO must break above the channel’s upper boundary. This resistance has acted as a barrier to the price, preventing any significant upward movement.
On the other hand, if the price fails to break this resistance and continues downward, it is likely to test the lower support of the descending channel.
Traders should monitor the price action closely, especially looking for a breakout above the descending channel, which would be a strong indicator of a potential bullish reversal. An increase in trading volume would provide further confirmation of this move.
Everything is on the chart.
노트
CELO is moving according to our plan. After 141 days CELO breaks the descending channel. 
면책사항
해당 정보와 게시물은 금융, 투자, 트레이딩 또는 기타 유형의 조언이나 권장 사항으로 간주되지 않으며, 트레이딩뷰에서 제공하거나 보증하는 것이 아닙니다. 자세한 내용은 이용 약관을 참조하세요.
면책사항
해당 정보와 게시물은 금융, 투자, 트레이딩 또는 기타 유형의 조언이나 권장 사항으로 간주되지 않으며, 트레이딩뷰에서 제공하거나 보증하는 것이 아닙니다. 자세한 내용은 이용 약관을 참조하세요.