Celer Network Full Chart Analysis
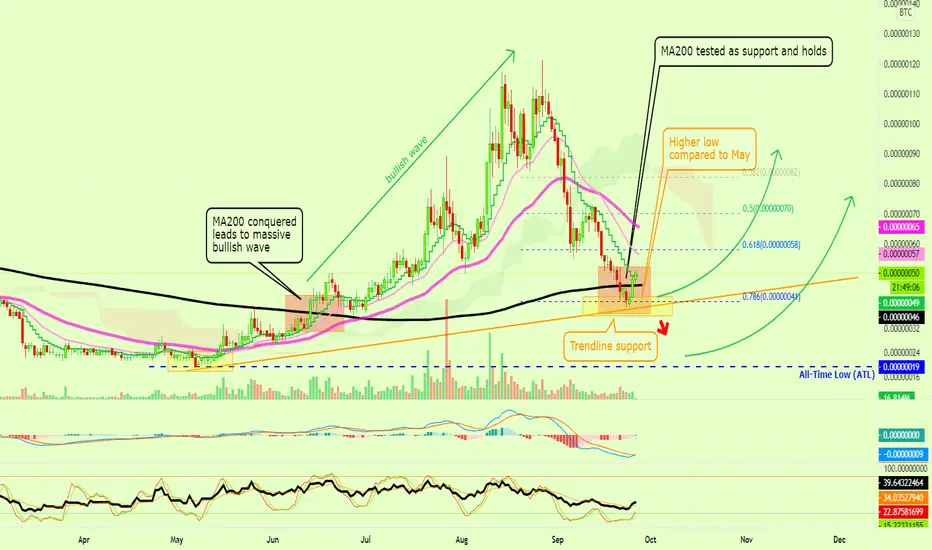
Celer Network (CELRBTC) started by conquering (moving and closing above) Ma200, the black line on the chart.
A strong bullish wave followed after this resistance was taken out... This level now turns support.
After CELRBTC peaked, it moved down to test MA200 as support, and this level holds.
A higher low is printed exactly at the 0.786 Fib. retracement.
We have 3 signals pointing to the 44-46 support range as being a strong one.
1) MA200
2) Trendline
3) 0.786 Fib.
There is more...
The MACD is showing hidden bullish divergence, which I explained in the ATOMBTC chart.
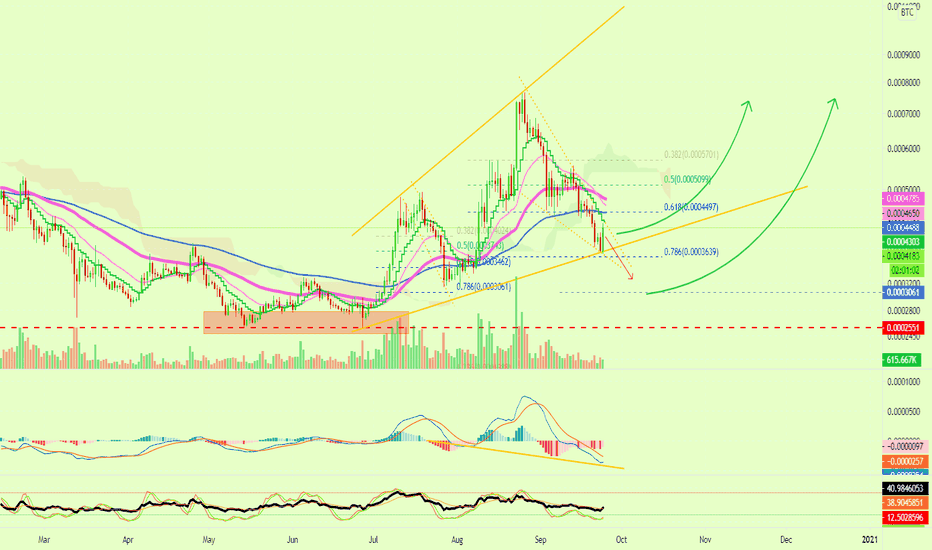
A young bullish crossover is also taking place on the same indicator; the MACD.
Prices can move up from here.
Another higher low... The altcoins continue to grow as predicted.
Thanks a lot for your support.
Namaste.
(Note: Check the related ideas below for previous charts on this pair)
A strong bullish wave followed after this resistance was taken out... This level now turns support.
After CELRBTC peaked, it moved down to test MA200 as support, and this level holds.
A higher low is printed exactly at the 0.786 Fib. retracement.
We have 3 signals pointing to the 44-46 support range as being a strong one.
1) MA200
2) Trendline
3) 0.786 Fib.
There is more...
The MACD is showing hidden bullish divergence, which I explained in the ATOMBTC chart.
A young bullish crossover is also taking place on the same indicator; the MACD.
Prices can move up from here.
Another higher low... The altcoins continue to grow as predicted.
Thanks a lot for your support.
Namaste.
(Note: Check the related ideas below for previous charts on this pair)

💯 Trading signals (results)
— Late 2026👇
t.me/masteranandatrades/9279
🔥 10-25X Leverage
—Trade-numbers:
t.me/masteranandatrades/9271
✅ PREMIUM &Content
—One-Time Payment
t.me/lamatrades/4 (🔝 since 2017)
— Late 2026👇
t.me/masteranandatrades/9279
🔥 10-25X Leverage
—Trade-numbers:
t.me/masteranandatrades/9271
✅ PREMIUM &Content
—One-Time Payment
t.me/lamatrades/4 (🔝 since 2017)
관련 발행물
면책사항
해당 정보와 게시물은 금융, 투자, 트레이딩 또는 기타 유형의 조언이나 권장 사항으로 간주되지 않으며, 트레이딩뷰에서 제공하거나 보증하는 것이 아닙니다. 자세한 내용은 이용 약관을 참조하세요.