Short
Canopy (CGC) update: 30-60 days downtrend?
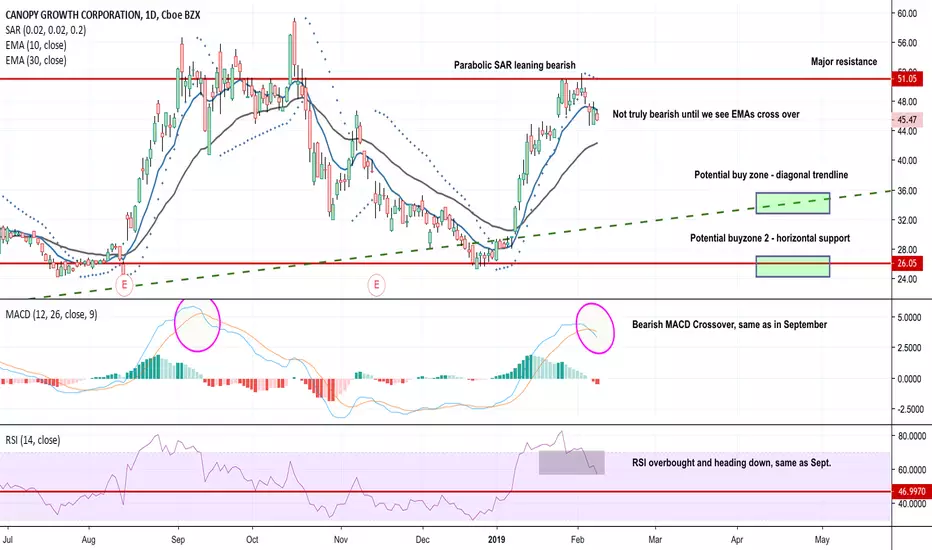
Update of previous chart on Canopy.
MACD, Parabolic Sar, RSI all looking pretty bearish and reminding me of previous chart action in the aftermath of the late 2018 price run-up.
However.. the EMAs (10 and 30) haven't crossed over, and to me that would need to happen to confirm a steep downtrend.
For now things are leaning bearish, if we see further confirmation in that direction, I'd be looking at 30 to 60 days of downtrend based on past price action.
So targeting a buy in March or April - but where would I place my buys?
+ Diagonal trendline
+ Horizontal support
Both of these seem like nice areas to put in some bids. Let's come back and see what happens.
MACD, Parabolic Sar, RSI all looking pretty bearish and reminding me of previous chart action in the aftermath of the late 2018 price run-up.
However.. the EMAs (10 and 30) haven't crossed over, and to me that would need to happen to confirm a steep downtrend.
For now things are leaning bearish, if we see further confirmation in that direction, I'd be looking at 30 to 60 days of downtrend based on past price action.
So targeting a buy in March or April - but where would I place my buys?
+ Diagonal trendline
+ Horizontal support
Both of these seem like nice areas to put in some bids. Let's come back and see what happens.
노트
Update:This is playing out as expected.
Wouldn't be surprised to see a little recovery from the touch of the 30 EMA, then a steady dump from beginning of next week.

관련 발행물
면책사항
해당 정보와 게시물은 금융, 투자, 트레이딩 또는 기타 유형의 조언이나 권장 사항으로 간주되지 않으며, 트레이딩뷰에서 제공하거나 보증하는 것이 아닙니다. 자세한 내용은 이용 약관을 참조하세요.
면책사항
해당 정보와 게시물은 금융, 투자, 트레이딩 또는 기타 유형의 조언이나 권장 사항으로 간주되지 않으며, 트레이딩뷰에서 제공하거나 보증하는 것이 아닙니다. 자세한 내용은 이용 약관을 참조하세요.