
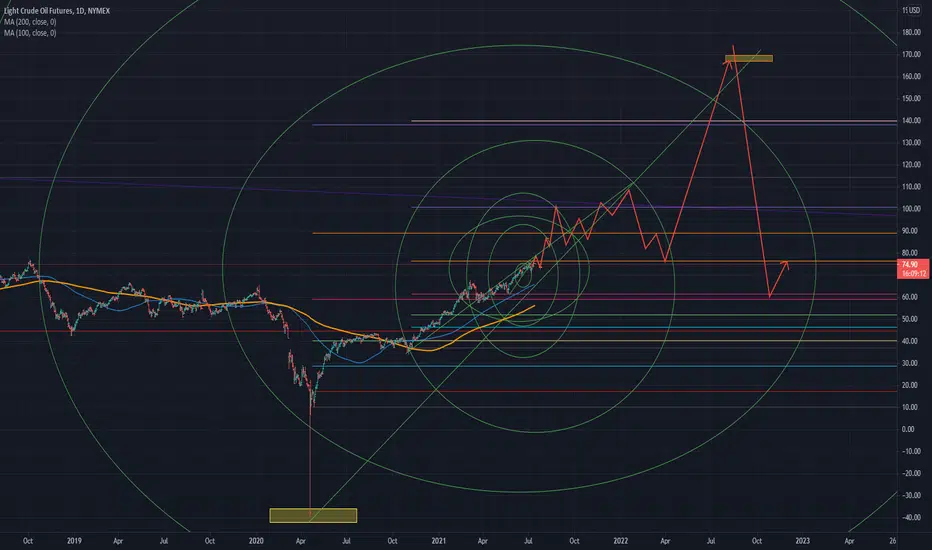
I used Fibonacci circles and used extensions. It is a prediction chart using wave properties. According to this chart, after hitting the $100 range in September of this year and falling, it rises again to $100 in early 2022, and then renews the highest price in 2022 after the decline.
Remember, this is just a personal scenario, not an exact calculation. The choice is yours
Remember, this is just a personal scenario, not an exact calculation. The choice is yours

면책사항
해당 정보와 게시물은 금융, 투자, 트레이딩 또는 기타 유형의 조언이나 권장 사항으로 간주되지 않으며, 트레이딩뷰에서 제공하거나 보증하는 것이 아닙니다. 자세한 내용은 이용 약관을 참조하세요.
면책사항
해당 정보와 게시물은 금융, 투자, 트레이딩 또는 기타 유형의 조언이나 권장 사항으로 간주되지 않으며, 트레이딩뷰에서 제공하거나 보증하는 것이 아닙니다. 자세한 내용은 이용 약관을 참조하세요.