
hi Readers,
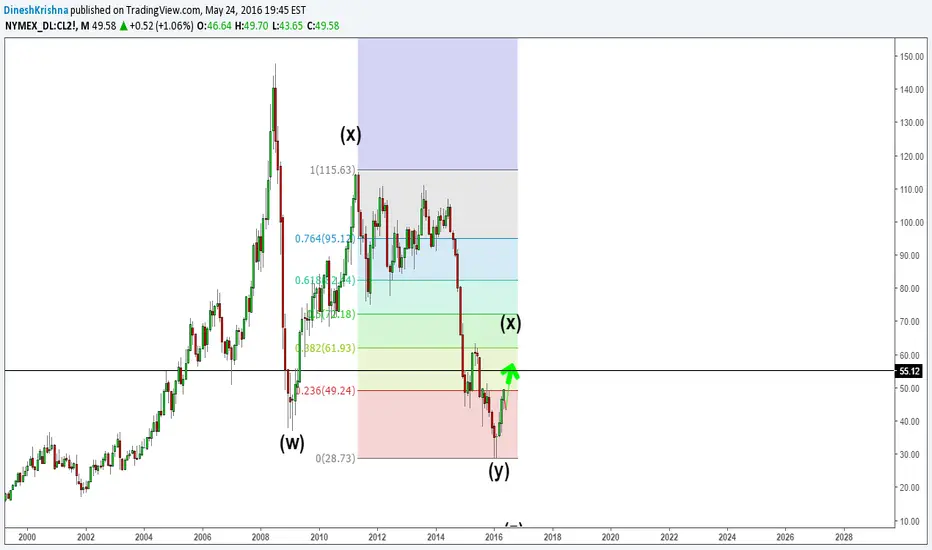
The Chart deals with weekly time Frame
As we now Know that the wave Y in Grand Super Cycle degree & hence the initiation of X wave after Y has pushed it to new highs, say to the current levels. The important idea is that the W within the current X wave in one lesser degree has been progressing as w,x,y,x & z within which waves W,X & Y are completed. so , after an intermediate downtrend for completing the X wave, the market resumes its upper trend to the areas of 55.12 $
For analysis below this degree, that is on daily time frame click here,mytradingcourses.com/
Thanks for reading
Feel free to contact us in need of any assistance
Happy Trading
Dinesh -senior Technical analyst
LeadBrains FSL - mytradingcourses.com Trading education & training firm

관련 발행물
면책사항
해당 정보와 게시물은 금융, 투자, 트레이딩 또는 기타 유형의 조언이나 권장 사항으로 간주되지 않으며, 트레이딩뷰에서 제공하거나 보증하는 것이 아닙니다. 자세한 내용은 이용 약관을 참조하세요.
면책사항
해당 정보와 게시물은 금융, 투자, 트레이딩 또는 기타 유형의 조언이나 권장 사항으로 간주되지 않으며, 트레이딩뷰에서 제공하거나 보증하는 것이 아닙니다. 자세한 내용은 이용 약관을 참조하세요.