CLVUSDT.1D
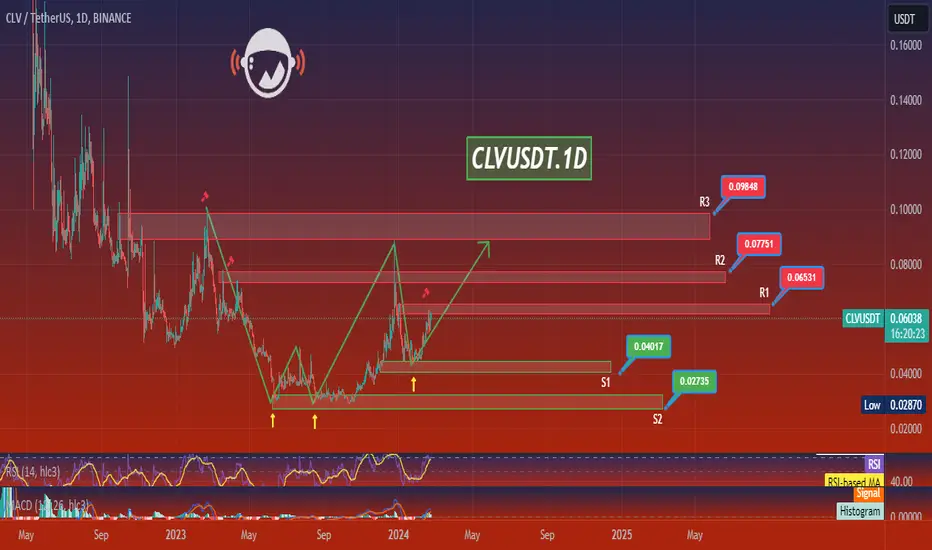
Based on the provided market data, the CLV currency is currently priced at 0.060 USDT. The RSI (Relative Strength Index) values for 4-hour, 1-day, and 7-day are 60.97, 69.90, and 60.97 respectively. These values indicate that the currency is neither overbought nor oversold. However, the 1-day RSI is nearing the overbought threshold of 70, so there might be a potential price pullback.
The MACD (Moving Average Convergence Divergence), a trend-following momentum indicator, shows positive values across all three timeframes (4-hour, 1-day, and 7-day), suggesting a bullish trend.
The Bollinger Bands for 4-hour, 1-day, and 7-day are 0.063, 0.064, and 0.065 respectively. The current price is below the upper band in all three timeframes, suggesting it's not in an overbought condition.
In terms of support and resistance levels, the immediate resistance levels are at 0.061 (4-hour), 0.065 (1-day), and 0.088 (7-day). If the price breaks these levels, it could continue to rise towards the next resistance level. On the downside, the immediate support levels are at 0.059 (4-hour), 0.053 (1-day), and 0.046 (7-day). If the price breaks these levels, it could continue to fall towards the next support level.
In conclusion, the market data suggests a bullish trend for CLV currency in the near term but investors should be cautious as the 1-day RSI is nearing the overbought threshold. As always, it's recommended to use these indicators in conjunction with other tools and to consider the overall market trend before making any investment decisions.
The MACD (Moving Average Convergence Divergence), a trend-following momentum indicator, shows positive values across all three timeframes (4-hour, 1-day, and 7-day), suggesting a bullish trend.
The Bollinger Bands for 4-hour, 1-day, and 7-day are 0.063, 0.064, and 0.065 respectively. The current price is below the upper band in all three timeframes, suggesting it's not in an overbought condition.
In terms of support and resistance levels, the immediate resistance levels are at 0.061 (4-hour), 0.065 (1-day), and 0.088 (7-day). If the price breaks these levels, it could continue to rise towards the next resistance level. On the downside, the immediate support levels are at 0.059 (4-hour), 0.053 (1-day), and 0.046 (7-day). If the price breaks these levels, it could continue to fall towards the next support level.
In conclusion, the market data suggests a bullish trend for CLV currency in the near term but investors should be cautious as the 1-day RSI is nearing the overbought threshold. As always, it's recommended to use these indicators in conjunction with other tools and to consider the overall market trend before making any investment decisions.

면책사항
해당 정보와 게시물은 금융, 투자, 트레이딩 또는 기타 유형의 조언이나 권장 사항으로 간주되지 않으며, 트레이딩뷰에서 제공하거나 보증하는 것이 아닙니다. 자세한 내용은 이용 약관을 참조하세요.
면책사항
해당 정보와 게시물은 금융, 투자, 트레이딩 또는 기타 유형의 조언이나 권장 사항으로 간주되지 않으며, 트레이딩뷰에서 제공하거나 보증하는 것이 아닙니다. 자세한 내용은 이용 약관을 참조하세요.