롱
$CND Accumulation Phase
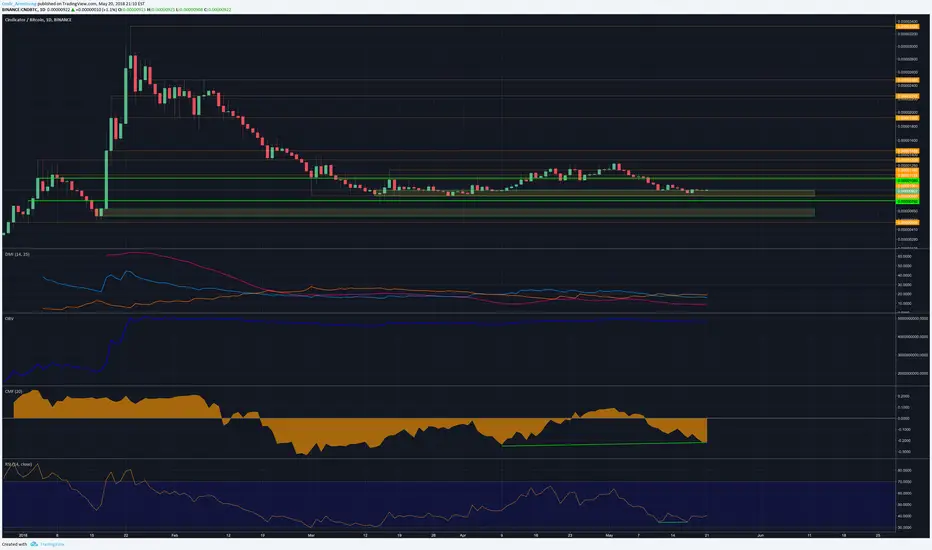
I believe we are currently seeing Cindicator in an accumulation phase. This is confirmed by the ADX trending below 20-25. We are seeing some weaker bullish divergences being created. This RSI div is a bullish regular divergence—however, as price make a lower low, the RSI only double bottoms. This indicates it is a moderately strong divergence.
I have highlighted two areas I am looking to accumulate in. However, I wouldn't be surprised if we do not reach lower prices. There is an enormous amount of support here, and without a bearish crypto catalyst I think this price level will hold.
I am a bit nervous considering the ETHBTC chart, however, this one seems to have bottomed out.

Don't get shaken out by small movements, we are trading in a strong weekly bullish OB. The range of this weekly bullish OB is shown on the daily chart by the two green horizontals. It will take a lot of sell pressure to get below this level in my opinion.
I have highlighted two areas I am looking to accumulate in. However, I wouldn't be surprised if we do not reach lower prices. There is an enormous amount of support here, and without a bearish crypto catalyst I think this price level will hold.
I am a bit nervous considering the ETHBTC chart, however, this one seems to have bottomed out.
Don't get shaken out by small movements, we are trading in a strong weekly bullish OB. The range of this weekly bullish OB is shown on the daily chart by the two green horizontals. It will take a lot of sell pressure to get below this level in my opinion.

관련 발행물
면책사항
해당 정보와 게시물은 금융, 투자, 트레이딩 또는 기타 유형의 조언이나 권장 사항으로 간주되지 않으며, 트레이딩뷰에서 제공하거나 보증하는 것이 아닙니다. 자세한 내용은 이용 약관을 참조하세요.
관련 발행물
면책사항
해당 정보와 게시물은 금융, 투자, 트레이딩 또는 기타 유형의 조언이나 권장 사항으로 간주되지 않으며, 트레이딩뷰에서 제공하거나 보증하는 것이 아닙니다. 자세한 내용은 이용 약관을 참조하세요.