
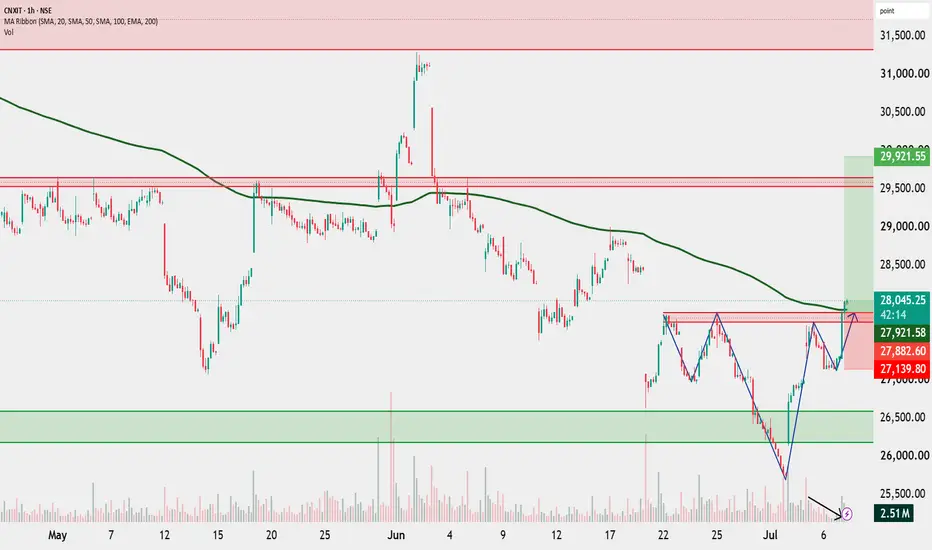
CNX IT is forming an Inverse Head and Shoulder pattern while also showing a bullish market structure with higher highs and higher lows after a Change of Character (ChoCH). Price is testing the neckline and the 200 EMA, making this a crucial resistance zone. A sustained close above 27,900–28,000 would confirm a Break of Structure (BOS) and strengthen the bullish outlook. Volume has declined during the pullback, indicating weak selling pressure. Wait for a confirmed breakout before taking any position.
Disclaimer: For educational purposes only. Not an investment recommendation. Please consult your registered financial advisor. I am only a SEBI Certified Research Analyst.
Disclaimer: For educational purposes only. Not an investment recommendation. Please consult your registered financial advisor. I am only a SEBI Certified Research Analyst.

관련 발행물
면책사항
해당 정보와 게시물은 금융, 투자, 트레이딩 또는 기타 유형의 조언이나 권장 사항으로 간주되지 않으며, 트레이딩뷰에서 제공하거나 보증하는 것이 아닙니다. 자세한 내용은 이용 약관을 참조하세요.
면책사항
해당 정보와 게시물은 금융, 투자, 트레이딩 또는 기타 유형의 조언이나 권장 사항으로 간주되지 않으며, 트레이딩뷰에서 제공하거나 보증하는 것이 아닙니다. 자세한 내용은 이용 약관을 참조하세요.