
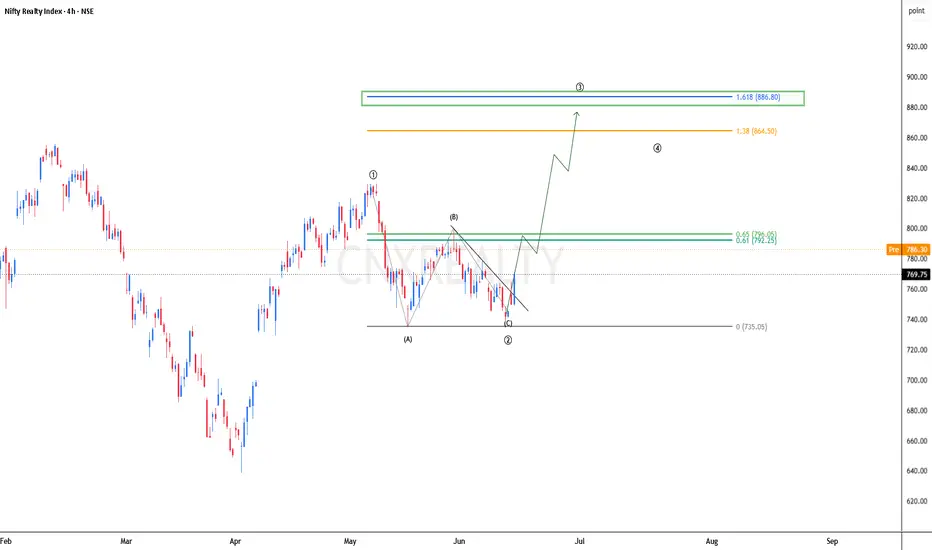
**Nifty Realty Index (4H) – Wave 3 Analysis**
The chart suggests that **Wave 2 correction has likely completed near 735**, and price is now attempting to start **Wave 3**, which is typically the strongest and fastest Elliott Wave advance.
### Bullish Structure
✅ Wave (1) completed near 820
✅ ABC correction formed Wave (2)
✅ Price has bounced from the Wave (2) low around 735
✅ Breakout above the corrective trendline indicates the beginning of Wave (3)
### Key Levels
* **Immediate Resistance:** 792 – 796 (0.61–0.65 Fib zone)
* **Confirmation Level:** Sustained move above 796
* **Wave 3 Target:** **886** (1.618 Fibonacci Extension)
* **Intermediate Resistance:** 864 (1.38 Extension)
### Market Outlook
If buyers maintain control and the index closes above the **796 resistance zone**, the probability increases that **Wave 3 has started**, with the next upside targets at **864** and ultimately **886**. Wave 3 often extends sharply, making 886 a realistic objective while the 735 low remains intact.
### Trading View Description
**"Nifty Realty appears to have completed its Wave 2 correction near 735 and is showing early signs of a Wave 3 advance. A breakout above the 796 resistance zone could confirm bullish momentum, opening the path toward 864 and the major Wave 3 target of 886 (1.618 Fibonacci Extension). The bullish structure remains valid as long as the 735 low holds."** 📈🚀

면책사항
해당 정보와 게시물은 금융, 투자, 트레이딩 또는 기타 유형의 조언이나 권장 사항으로 간주되지 않으며, 트레이딩뷰에서 제공하거나 보증하는 것이 아닙니다. 자세한 내용은 이용 약관을 참조하세요.
면책사항
해당 정보와 게시물은 금융, 투자, 트레이딩 또는 기타 유형의 조언이나 권장 사항으로 간주되지 않으며, 트레이딩뷰에서 제공하거나 보증하는 것이 아닙니다. 자세한 내용은 이용 약관을 참조하세요.