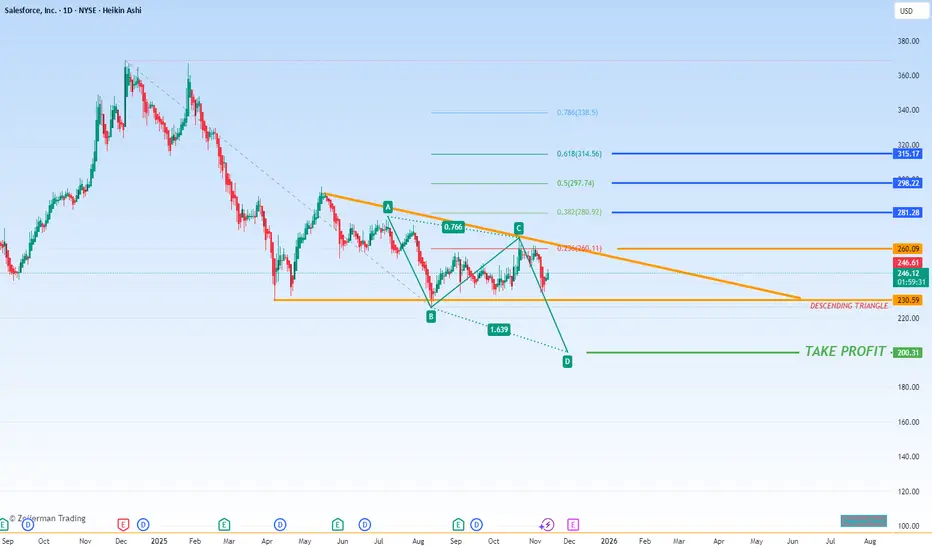
A technical examination of Salesforce's ( CRM) price chart reveals a compelling and potentially decisive consolidation pattern currently in play. The prevailing structure points towards a bearish inclination, but it is also setting the stage for a significant breakout move in either direction.
1. The Prevailing Bearish Evidence: Descending Triangle & ABCD Pattern
The primary pattern of note is a Descending Triangle. This is typically considered a bearish continuation pattern, formed by a flat support level at the bottom and a series of lower highs creating a descending trendline at the top. ForCRM, the key support floor appears to be around the $230 - $235 level, which price has tested and held multiple times. The descending resistance trendline, currently near $260, acts as a ceiling that is progressively lowering.
Adding further weight to the bearish case is the presence of a completed bearish ABCD pattern within the larger triangle. This harmonic pattern signifies a corrective (bearish) move followed by a retracement, suggesting that the path of least resistance prior to the breakout may be to the downside.
2. The Impending Breakout: Two Scenarios
The significance of a descending triangle lies in the eventual breakout, which can be explosive. The market is coiling, and a decisive move above resistance or below support will dictate the next major trend.
Scenario A: Bullish Breakout (Upside Target)
A decisive and high-volume break above the $260 descending resistance trendline would invalidate the immediate bearish outlook and signal a powerful shift in momentum. In this case, the pattern's measuring implications project a move upward. Using Fibonacci extension levels from the pattern's height, the primary upside price targets would be:
First Target (0.382 Fib): $280.92
Second Target (0.5 Fib): $297.74
Extended Target (0.618 Fib): $314.56
A move to the $297 level would also often align with a retest of the triangle's upper boundary, now acting as new support.
Scenario B: Bearish Breakout (Downside Target)
If the bearish implications of the pattern hold true and the crucial support at $230 - $235 is broken with conviction, it would confirm a continuation of the prior downtrend. The measured move target for a descending triangle breakdown is typically calculated by projecting the height of the pattern's widest point downward from the point of breakdown. This projects a significant decline toward the $200 psychological support level. This area represents a key long-term value zone and would likely be a major test for the stock's health.
Conclusion and Key Levels to Watch
In summary,CRM is at a critical technical juncture, compressed within a descending triangle. While the internal patterns suggest a bearish bias, the outcome is not confirmed until a breakout occurs.
Bullish Trigger: A break and close above $260. Confirmation would be a follow-through move above this level with strong volume.
Bearish Trigger: A break and close below the $230 - $235 support zone.
Neutral Stance: Until one of these levels is breached, the stock is likely to continue its sideways consolidation within the triangle.
Traders and investors should monitor these key levels closely, as the breakout will likely determineCRM's directional bias for the medium term.
CRM) price chart reveals a compelling and potentially decisive consolidation pattern currently in play. The prevailing structure points towards a bearish inclination, but it is also setting the stage for a significant breakout move in either direction.1. The Prevailing Bearish Evidence: Descending Triangle & ABCD Pattern
The primary pattern of note is a Descending Triangle. This is typically considered a bearish continuation pattern, formed by a flat support level at the bottom and a series of lower highs creating a descending trendline at the top. For
CRM, the key support floor appears to be around the $230 - $235 level, which price has tested and held multiple times. The descending resistance trendline, currently near $260, acts as a ceiling that is progressively lowering.Adding further weight to the bearish case is the presence of a completed bearish ABCD pattern within the larger triangle. This harmonic pattern signifies a corrective (bearish) move followed by a retracement, suggesting that the path of least resistance prior to the breakout may be to the downside.
2. The Impending Breakout: Two Scenarios
The significance of a descending triangle lies in the eventual breakout, which can be explosive. The market is coiling, and a decisive move above resistance or below support will dictate the next major trend.
Scenario A: Bullish Breakout (Upside Target)
A decisive and high-volume break above the $260 descending resistance trendline would invalidate the immediate bearish outlook and signal a powerful shift in momentum. In this case, the pattern's measuring implications project a move upward. Using Fibonacci extension levels from the pattern's height, the primary upside price targets would be:
First Target (0.382 Fib): $280.92
Second Target (0.5 Fib): $297.74
Extended Target (0.618 Fib): $314.56
A move to the $297 level would also often align with a retest of the triangle's upper boundary, now acting as new support.
Scenario B: Bearish Breakout (Downside Target)
If the bearish implications of the pattern hold true and the crucial support at $230 - $235 is broken with conviction, it would confirm a continuation of the prior downtrend. The measured move target for a descending triangle breakdown is typically calculated by projecting the height of the pattern's widest point downward from the point of breakdown. This projects a significant decline toward the $200 psychological support level. This area represents a key long-term value zone and would likely be a major test for the stock's health.
Conclusion and Key Levels to Watch
In summary,
CRM is at a critical technical juncture, compressed within a descending triangle. While the internal patterns suggest a bearish bias, the outcome is not confirmed until a breakout occurs.Bullish Trigger: A break and close above $260. Confirmation would be a follow-through move above this level with strong volume.
Bearish Trigger: A break and close below the $230 - $235 support zone.
Neutral Stance: Until one of these levels is breached, the stock is likely to continue its sideways consolidation within the triangle.
Traders and investors should monitor these key levels closely, as the breakout will likely determine
CRM's directional bias for the medium term.
면책사항
해당 정보와 게시물은 금융, 투자, 트레이딩 또는 기타 유형의 조언이나 권장 사항으로 간주되지 않으며, 트레이딩뷰에서 제공하거나 보증하는 것이 아닙니다. 자세한 내용은 이용 약관을 참조하세요.
면책사항
해당 정보와 게시물은 금융, 투자, 트레이딩 또는 기타 유형의 조언이나 권장 사항으로 간주되지 않으며, 트레이딩뷰에서 제공하거나 보증하는 것이 아닙니다. 자세한 내용은 이용 약관을 참조하세요.