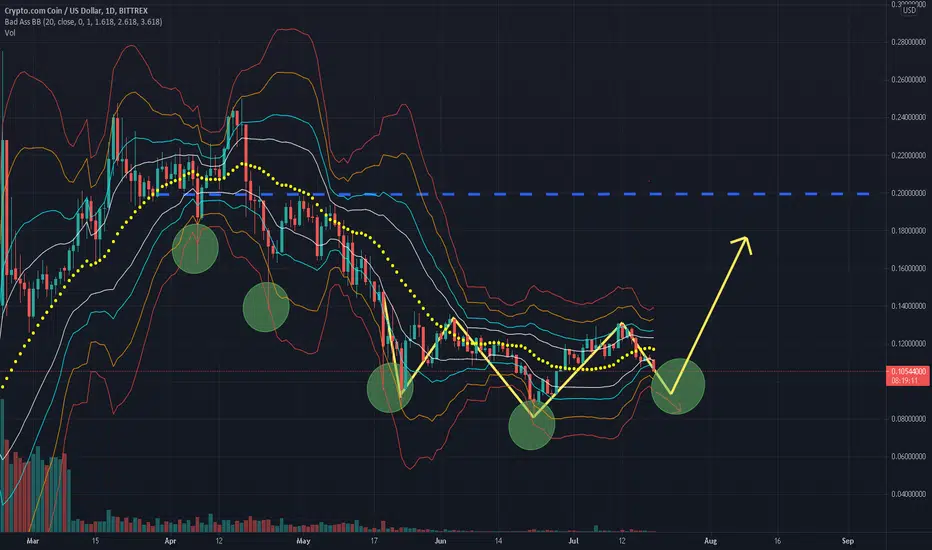
Inverse H & S pattern showing. Daily candles also look like they're inching toward the red lower Bollinger Band, indicating strong potential for a bounce. I believe we still need the right shoulder to connect with the left shoulder of the pattern at approx $0.09~ for the bounce to occur. The target for this pattern would be just below $0.20 where last resistance occurred.
Not financial advice, just my opinion.
Not financial advice, just my opinion.

면책사항
해당 정보와 게시물은 금융, 투자, 트레이딩 또는 기타 유형의 조언이나 권장 사항으로 간주되지 않으며, 트레이딩뷰에서 제공하거나 보증하는 것이 아닙니다. 자세한 내용은 이용 약관을 참조하세요.
면책사항
해당 정보와 게시물은 금융, 투자, 트레이딩 또는 기타 유형의 조언이나 권장 사항으로 간주되지 않으며, 트레이딩뷰에서 제공하거나 보증하는 것이 아닙니다. 자세한 내용은 이용 약관을 참조하세요.