
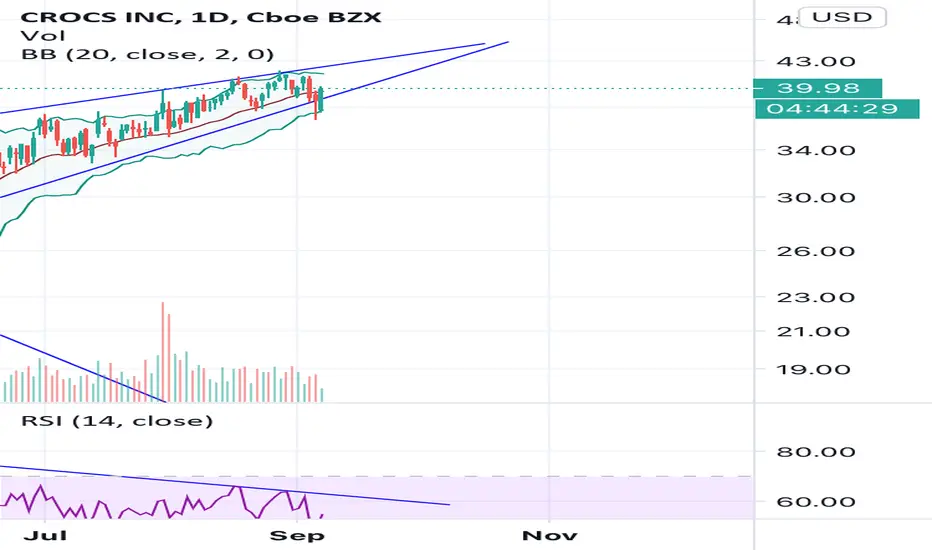
In spite of market weakness, ticker CROX is still holding its support line after briefly dipping below. This indicates high buying pressure. Expect CROX follow the uptrend until it hits the resistance line. Look for contracted volatility to predict when a breakout might happen. I would set a stop buy order or Open a call at a point above 42.50 (43 just to be safe. The RSI and Bollinger bands indicate much of the same: confined price swings while it is stuck in a wedge. In my opinion, there is a 2-month flag pattern being formed. A flag pattern is a Breakout followed by a wedge/ triangle pattern, followed by another breakout in the same direction. Accordingly, I am bullish on this stock in the near term.

관련 발행물
면책사항
해당 정보와 게시물은 금융, 투자, 트레이딩 또는 기타 유형의 조언이나 권장 사항으로 간주되지 않으며, 트레이딩뷰에서 제공하거나 보증하는 것이 아닙니다. 자세한 내용은 이용 약관을 참조하세요.
면책사항
해당 정보와 게시물은 금융, 투자, 트레이딩 또는 기타 유형의 조언이나 권장 사항으로 간주되지 않으며, 트레이딩뷰에서 제공하거나 보증하는 것이 아닙니다. 자세한 내용은 이용 약관을 참조하세요.