
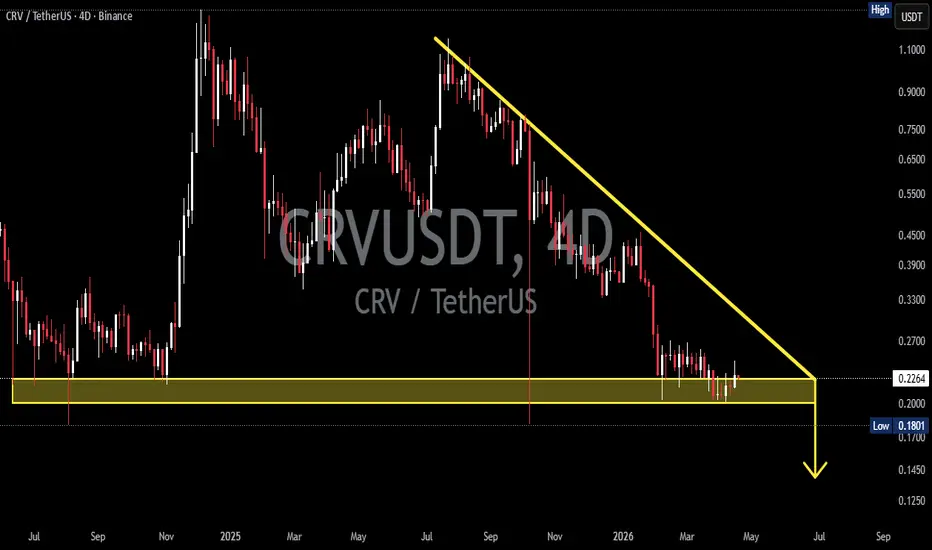
This CRVUSDT 4D chart (as of April 19, 2026) displays a very clear and classic technical structure: a Descending Triangle pattern that has been forming for almost a year.
Key Elements of the Pattern:
- Strong Horizontal Support (flat yellow line at ~0.2248 – 0.22): This level has held since mid-2024 and has been tested multiple times as a long-term “floor.” Price has always bounced from here in the past.
- Descending Trendline (Downward Resistance) (sloping yellow line from upper left to lower right): Connecting lower highs since the major peak in July 2025 (~1.0+). Every rally has failed to go higher, showing increasing seller dominance.
- Apex (Convergence Point): Price is currently right at the right edge of the triangle, sitting exactly on the horizontal support. This is a high-stakes decision zone.
Overall Price Action:
- 2024 – Early 2025: High volatility with two major pumps (late 2024 & May 2025) creating temporary higher highs.
- Mid-2025 to present: Sharp and consistent decline, forming clear lower highs.
- Currently, price is at 0.2248, very close to the recent low of 0.1801 that was touched earlier.
The Descending Triangle is a bearish continuation pattern with a historical breakdown probability of ~70-80% (especially in a major downtrend like this).
Bullish Scenario (Currently Less Likely):
- Price must bounce strongly from the 0.22 support with a long bullish candle + increasing volume.
- Valid breakout above the descending trendline (around 0.27–0.30 zone).
- Potential targets:
1. 0.39 – 0.45 (previous minor resistance)
2. 0.55 – 0.65 (0.5 Fibonacci retracement from swing high)
3. If momentum is very strong → retest 0.90–1.10 (old supply area)
- Bearish scenario invalidation: 4D close above the descending trendline.
Bearish Scenario (More Dominant & Chart-Aligned):
- Breakdown below the horizontal support at 0.2248 with a strong bearish candle close + volume confirmation.
- Main targets using the measured move of the triangle pattern:
- Triangle height (~0.80–0.90) projected downward → primary target 0.17 – 0.1450.
- The yellow arrow on the chart already points in this direction (target around 0.17).
- Next supports: 0.1450 → 0.1250 (historical lows).
- If the overall crypto market turns more bearish, it could go even deeper.
Technical Conclusion:
The current structure is bearishly dominant. The 0.22 support is the “last line of defense.” As long as price remains inside the triangle and below the descending trendline, the probability of a breakdown is higher. Traders must be very cautious in this zone — false breakouts or wicks are common at the apex of a triangle.
#CRVUSDT #CRV #DescendingTriangle #TechnicalAnalysis #CryptoAnalysis #Altcoin #CryptoTrading #BearishPattern #SupportBreak #CRVAnalysis
Key Elements of the Pattern:
- Strong Horizontal Support (flat yellow line at ~0.2248 – 0.22): This level has held since mid-2024 and has been tested multiple times as a long-term “floor.” Price has always bounced from here in the past.
- Descending Trendline (Downward Resistance) (sloping yellow line from upper left to lower right): Connecting lower highs since the major peak in July 2025 (~1.0+). Every rally has failed to go higher, showing increasing seller dominance.
- Apex (Convergence Point): Price is currently right at the right edge of the triangle, sitting exactly on the horizontal support. This is a high-stakes decision zone.
Overall Price Action:
- 2024 – Early 2025: High volatility with two major pumps (late 2024 & May 2025) creating temporary higher highs.
- Mid-2025 to present: Sharp and consistent decline, forming clear lower highs.
- Currently, price is at 0.2248, very close to the recent low of 0.1801 that was touched earlier.
The Descending Triangle is a bearish continuation pattern with a historical breakdown probability of ~70-80% (especially in a major downtrend like this).
Bullish Scenario (Currently Less Likely):
- Price must bounce strongly from the 0.22 support with a long bullish candle + increasing volume.
- Valid breakout above the descending trendline (around 0.27–0.30 zone).
- Potential targets:
1. 0.39 – 0.45 (previous minor resistance)
2. 0.55 – 0.65 (0.5 Fibonacci retracement from swing high)
3. If momentum is very strong → retest 0.90–1.10 (old supply area)
- Bearish scenario invalidation: 4D close above the descending trendline.
Bearish Scenario (More Dominant & Chart-Aligned):
- Breakdown below the horizontal support at 0.2248 with a strong bearish candle close + volume confirmation.
- Main targets using the measured move of the triangle pattern:
- Triangle height (~0.80–0.90) projected downward → primary target 0.17 – 0.1450.
- The yellow arrow on the chart already points in this direction (target around 0.17).
- Next supports: 0.1450 → 0.1250 (historical lows).
- If the overall crypto market turns more bearish, it could go even deeper.
Technical Conclusion:
The current structure is bearishly dominant. The 0.22 support is the “last line of defense.” As long as price remains inside the triangle and below the descending trendline, the probability of a breakdown is higher. Traders must be very cautious in this zone — false breakouts or wicks are common at the apex of a triangle.
#CRVUSDT #CRV #DescendingTriangle #TechnicalAnalysis #CryptoAnalysis #Altcoin #CryptoTrading #BearishPattern #SupportBreak #CRVAnalysis

✅ Get Free Signals! Join Our Telegram Channel Here: t.me/TheCryptoNuclear
✅ Twitter: twitter.com/crypto_nuclear
✅ Join Bybit : partner.bybit.com/b/nuclearvip
✅ Benefits : Lifetime Trading Fee Discount -50%
✅ Twitter: twitter.com/crypto_nuclear
✅ Join Bybit : partner.bybit.com/b/nuclearvip
✅ Benefits : Lifetime Trading Fee Discount -50%
면책사항
해당 정보와 게시물은 금융, 투자, 트레이딩 또는 기타 유형의 조언이나 권장 사항으로 간주되지 않으며, 트레이딩뷰에서 제공하거나 보증하는 것이 아닙니다. 자세한 내용은 이용 약관을 참조하세요.
✅ Get Free Signals! Join Our Telegram Channel Here: t.me/TheCryptoNuclear
✅ Twitter: twitter.com/crypto_nuclear
✅ Join Bybit : partner.bybit.com/b/nuclearvip
✅ Benefits : Lifetime Trading Fee Discount -50%
✅ Twitter: twitter.com/crypto_nuclear
✅ Join Bybit : partner.bybit.com/b/nuclearvip
✅ Benefits : Lifetime Trading Fee Discount -50%
면책사항
해당 정보와 게시물은 금융, 투자, 트레이딩 또는 기타 유형의 조언이나 권장 사항으로 간주되지 않으며, 트레이딩뷰에서 제공하거나 보증하는 것이 아닙니다. 자세한 내용은 이용 약관을 참조하세요.