CS Group - CSGN
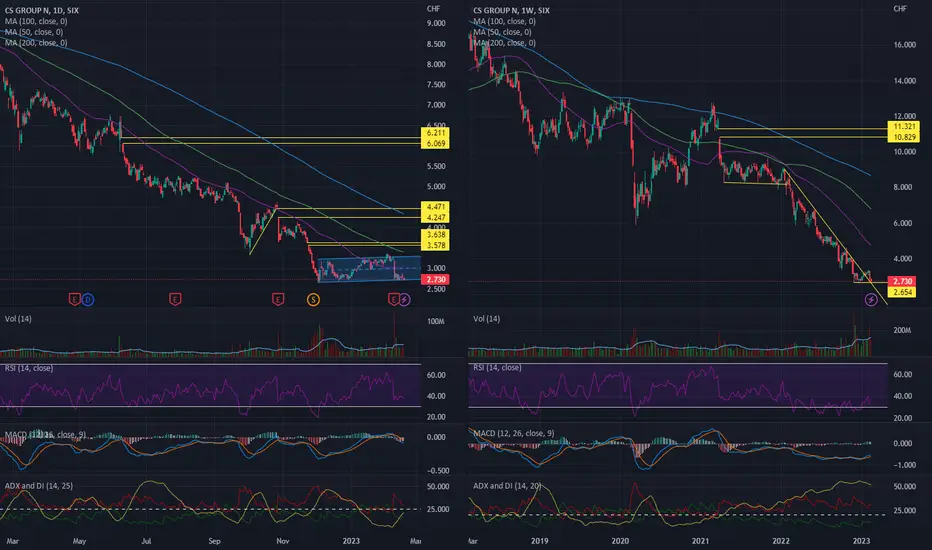
• Slightly upside corridor since beginning December 2022 (daily chart on the left side)
• The stock is currently trading at the bottom of the corridor (left side chart)
• Low volume in the last days (left side chart)
• Break out of the decreasing trend line in the last weeks (weekly chart on the right side)
• Supportline at 2.654 (right side chart)
• MACD line crossed the MACD Signal upward, which supports the outbreak of the decreasing trendline (right side chart)
• Stay neutral and wait if the support will hold
• The stock is currently trading at the bottom of the corridor (left side chart)
• Low volume in the last days (left side chart)
• Break out of the decreasing trend line in the last weeks (weekly chart on the right side)
• Supportline at 2.654 (right side chart)
• MACD line crossed the MACD Signal upward, which supports the outbreak of the decreasing trendline (right side chart)
• Stay neutral and wait if the support will hold

면책사항
해당 정보와 게시물은 금융, 투자, 트레이딩 또는 기타 유형의 조언이나 권장 사항으로 간주되지 않으며, 트레이딩뷰에서 제공하거나 보증하는 것이 아닙니다. 자세한 내용은 이용 약관을 참조하세요.
면책사항
해당 정보와 게시물은 금융, 투자, 트레이딩 또는 기타 유형의 조언이나 권장 사항으로 간주되지 않으며, 트레이딩뷰에서 제공하거나 보증하는 것이 아닙니다. 자세한 내용은 이용 약관을 참조하세요.