#CTSI/BTC (May 31)
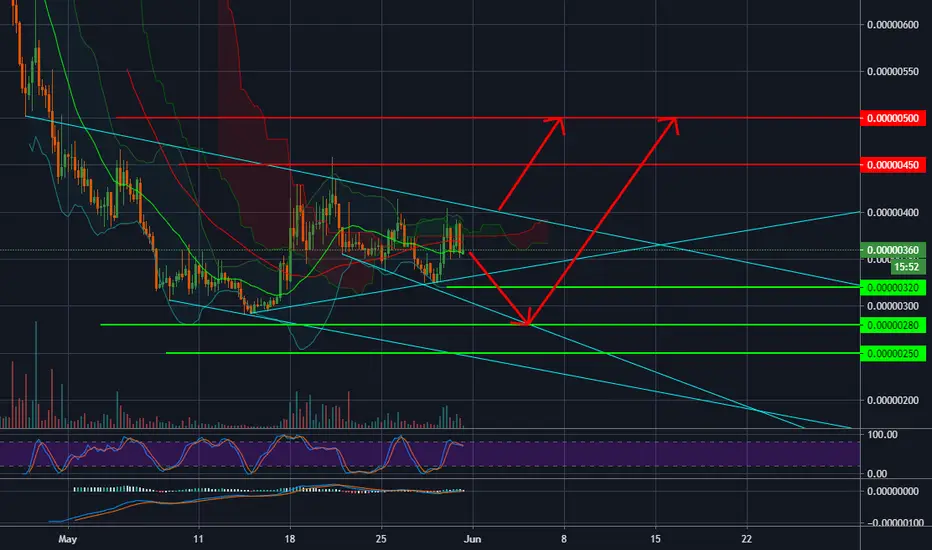
At this moment, what we can see on CTSI chart is that the selling force is dominant and the purpose of pushing the price up is to sell large quantities of CTSI.
In addition, CTSI is in a very bad pattern, Symmetrical Triangle in downtrend, so the price direction is moving down.
We will buy CTSI in 2 cases :
- Break out and stand stable above 400sts
- Catch gradually at these points : 320 - 280 and 250sts
The nearest sell target is 450 and 500
In addition, CTSI is in a very bad pattern, Symmetrical Triangle in downtrend, so the price direction is moving down.
We will buy CTSI in 2 cases :
- Break out and stand stable above 400sts
- Catch gradually at these points : 320 - 280 and 250sts
The nearest sell target is 450 and 500

면책사항
해당 정보와 게시물은 금융, 투자, 트레이딩 또는 기타 유형의 조언이나 권장 사항으로 간주되지 않으며, 트레이딩뷰에서 제공하거나 보증하는 것이 아닙니다. 자세한 내용은 이용 약관을 참조하세요.
면책사항
해당 정보와 게시물은 금융, 투자, 트레이딩 또는 기타 유형의 조언이나 권장 사항으로 간주되지 않으며, 트레이딩뷰에서 제공하거나 보증하는 것이 아닙니다. 자세한 내용은 이용 약관을 참조하세요.