업데이트됨
Wait & watch
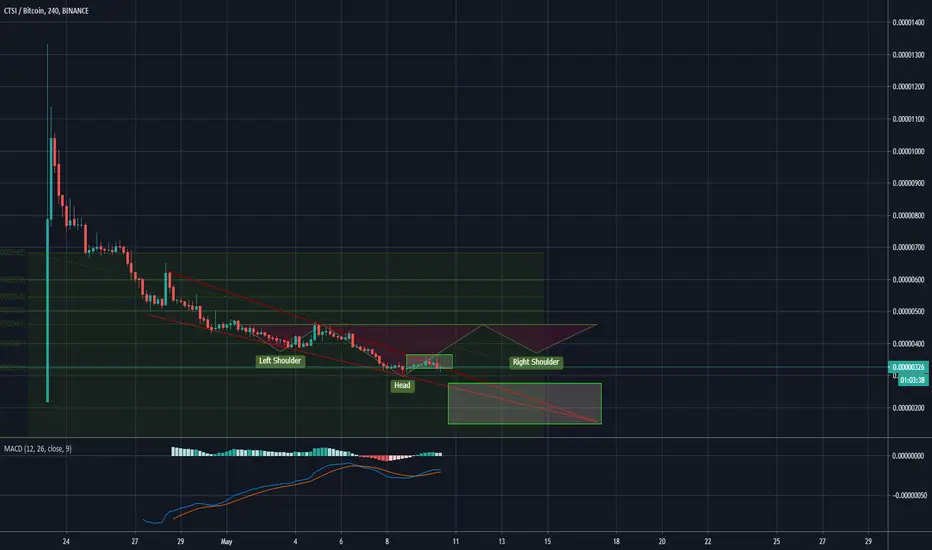
After last positive analysis, CTSI has fallen back into his downtrend falling wedge pattern.
Best buy for us would be when we breakout with volume out of this wedge which is indicated with a green rectangle box.
Alternatively, accumulation range would be between 150-250 sats from which we can expect a upward movement confidently.
Regards
Best buy for us would be when we breakout with volume out of this wedge which is indicated with a green rectangle box.
Alternatively, accumulation range would be between 150-250 sats from which we can expect a upward movement confidently.
Regards
액티브 트레이드
Trying to break out of the 4 step downward parabolic curve formation, The volume is there but i would personally be weary to enter the trade when BTC is at the crucial juncture of 10k.
CTSI needs to break 417sats to break from the primary resistance of the curve.
거래청산: 타겟 닿음

관련 발행물
면책사항
해당 정보와 게시물은 금융, 투자, 트레이딩 또는 기타 유형의 조언이나 권장 사항으로 간주되지 않으며, 트레이딩뷰에서 제공하거나 보증하는 것이 아닙니다. 자세한 내용은 이용 약관을 참조하세요.
면책사항
해당 정보와 게시물은 금융, 투자, 트레이딩 또는 기타 유형의 조언이나 권장 사항으로 간주되지 않으며, 트레이딩뷰에서 제공하거나 보증하는 것이 아닙니다. 자세한 내용은 이용 약관을 참조하세요.