
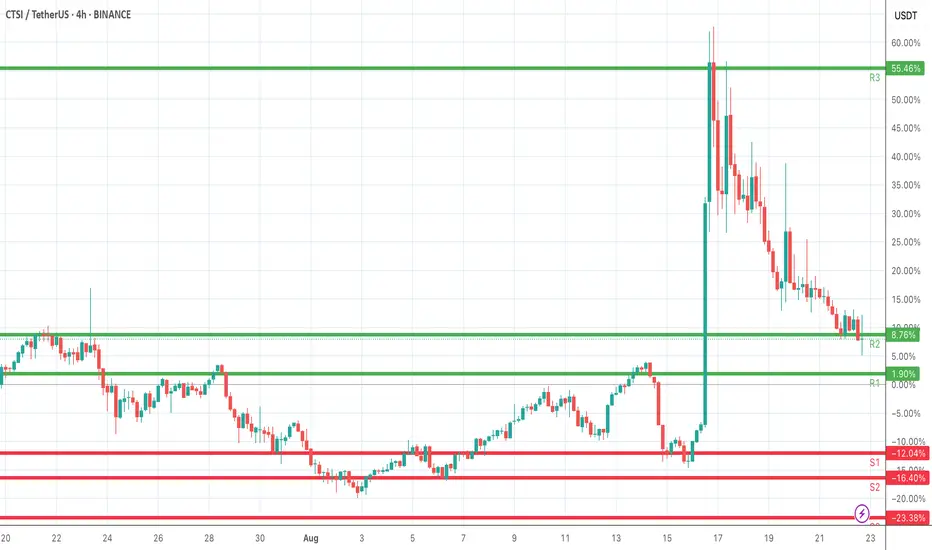
CTSI/USDT 4H chart
Levels:
• Resistance (R3): ~55.46%
• Resistance (R2): ~8.76%
• Resistance (R1): ~1.90%
• Support (S1): ~-12.04%
• Support (S2): ~-16.40%
• Support Zone: extends toward ~-23.38%
What the chart shows:
1. Price pumped hard to R3 (55.46%) but got rejected strongly.
2. Now it’s consolidating near R2 (8.76%), struggling to hold above it.
3. If it loses momentum, it may retest R1 (1.90%) or even dip into the support zone (S1–S2).
4. For a bullish move again, price must break and hold above R2 → R3, which seems like a tough resistance zone.
Trading perspective:
• Bullish case: If CTSI bounces above R2 and sustains, it could attempt another leg up.
• Bearish case: If it fails to hold R2, we might see a drop toward S1/S2.
At the moment, momentum looks weakened (lots of red candles after the big pump), so it may consolidate or retest support before any big move.
Levels:
• Resistance (R3): ~55.46%
• Resistance (R2): ~8.76%
• Resistance (R1): ~1.90%
• Support (S1): ~-12.04%
• Support (S2): ~-16.40%
• Support Zone: extends toward ~-23.38%
What the chart shows:
1. Price pumped hard to R3 (55.46%) but got rejected strongly.
2. Now it’s consolidating near R2 (8.76%), struggling to hold above it.
3. If it loses momentum, it may retest R1 (1.90%) or even dip into the support zone (S1–S2).
4. For a bullish move again, price must break and hold above R2 → R3, which seems like a tough resistance zone.
Trading perspective:
• Bullish case: If CTSI bounces above R2 and sustains, it could attempt another leg up.
• Bearish case: If it fails to hold R2, we might see a drop toward S1/S2.
At the moment, momentum looks weakened (lots of red candles after the big pump), so it may consolidate or retest support before any big move.

면책사항
해당 정보와 게시물은 금융, 투자, 트레이딩 또는 기타 유형의 조언이나 권장 사항으로 간주되지 않으며, 트레이딩뷰에서 제공하거나 보증하는 것이 아닙니다. 자세한 내용은 이용 약관을 참조하세요.
면책사항
해당 정보와 게시물은 금융, 투자, 트레이딩 또는 기타 유형의 조언이나 권장 사항으로 간주되지 않으며, 트레이딩뷰에서 제공하거나 보증하는 것이 아닙니다. 자세한 내용은 이용 약관을 참조하세요.