
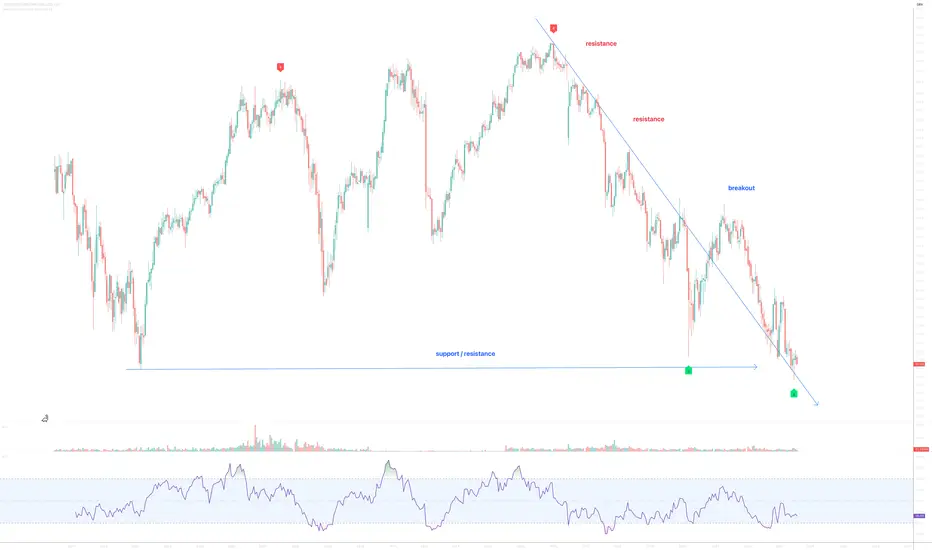
** investment opportunity **
On the above 12 day chart price action has corrected 90% since 2016. An excellent long opportunity. Why?
1) Price action and RSI resistance breakouts.
2) Price action on macro support and resistance.
3) Strong bullish divergence as measured over..
4) Some other stuff, will say elsewhere.
Is it possible price action falls further? Sure.
Is it probable? no
Ww
Type: Investment
Risk: <=6% of portfolio
Timeframe: Be long before the summer turns to Autumn
Return: Will say elsewhere
Stop loss: Will say elsewhere
On the above 12 day chart price action has corrected 90% since 2016. An excellent long opportunity. Why?
1) Price action and RSI resistance breakouts.
2) Price action on macro support and resistance.
3) Strong bullish divergence as measured over..
4) Some other stuff, will say elsewhere.
Is it possible price action falls further? Sure.
Is it probable? no
Ww
Type: Investment
Risk: <=6% of portfolio
Timeframe: Be long before the summer turns to Autumn
Return: Will say elsewhere
Stop loss: Will say elsewhere
액티브 트레이드
support confirmed노트
Up 30% so far.노트
60% return until now. No action required.노트
Add to existing long positions between 62 and 65노트
Well done if you added to existing long positions from the recent market hiccups.The next retail FOMO rush will take price action to 140.
액티브 트레이드
** resistance breakout **Keep holding until around 700
노트
up and up... 노트
Happy you snapped it up at 50 ?? 노트
Up around 160% Daily signal indicates 80% chance of correction in price action before the next leg up.

면책사항
해당 정보와 게시물은 금융, 투자, 트레이딩 또는 기타 유형의 조언이나 권장 사항으로 간주되지 않으며, 트레이딩뷰에서 제공하거나 보증하는 것이 아닙니다. 자세한 내용은 이용 약관을 참조하세요.
면책사항
해당 정보와 게시물은 금융, 투자, 트레이딩 또는 기타 유형의 조언이나 권장 사항으로 간주되지 않으며, 트레이딩뷰에서 제공하거나 보증하는 것이 아닙니다. 자세한 내용은 이용 약관을 참조하세요.