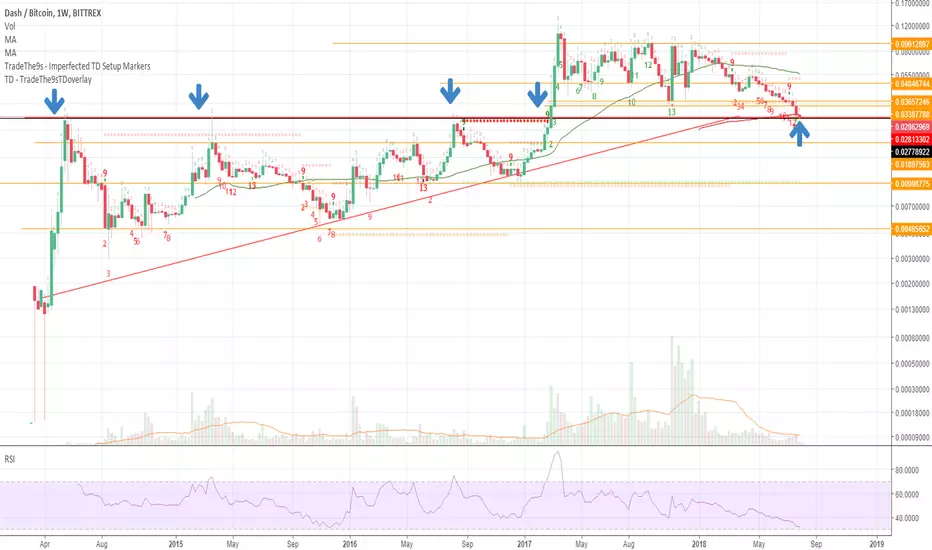
DDASHBTC testing a critical level on the weekly chart this week.
As you can see from the arrows, this level (black line) was tested multiple times before DASH had its massive breakout in 2017.
Zooming in on the 12H time frame below...you can see how the 12H came down to this line on a Perfected Buy Set Up and then flipped before completing the Set Up (Bullish).
Now trending back towards this level. Should it hold, will consider substantial long position.

면책사항
해당 정보와 게시물은 금융, 투자, 트레이딩 또는 기타 유형의 조언이나 권장 사항으로 간주되지 않으며, 트레이딩뷰에서 제공하거나 보증하는 것이 아닙니다. 자세한 내용은 이용 약관을 참조하세요.
면책사항
해당 정보와 게시물은 금융, 투자, 트레이딩 또는 기타 유형의 조언이나 권장 사항으로 간주되지 않으며, 트레이딩뷰에서 제공하거나 보증하는 것이 아닙니다. 자세한 내용은 이용 약관을 참조하세요.