
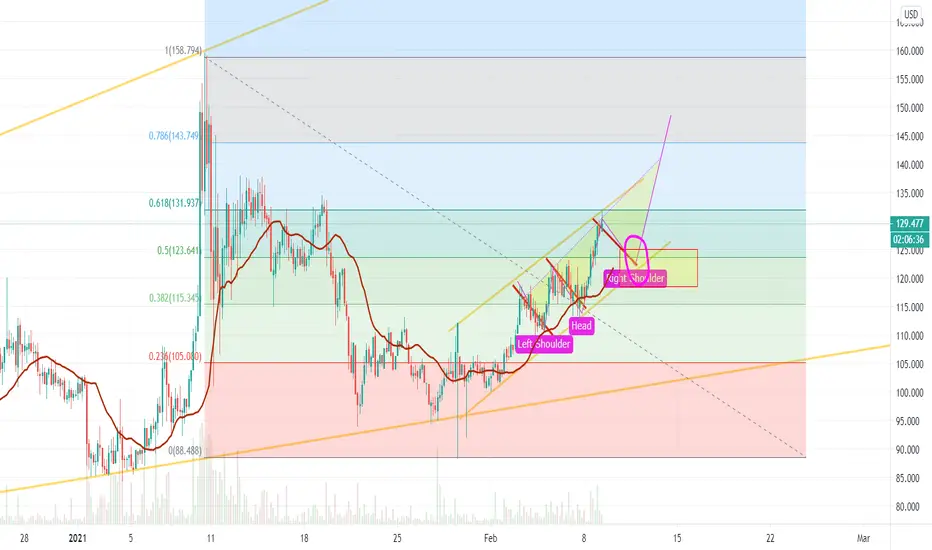
Dash has been trading inside our weekly trend lines for about 4 months. It reached a high around the 10th of Jan and has been bearish ever since (inside weekly trend lines). Bullish patterns started showing around the 29th of January reaching higher highs and lower lows inside the Golden Ratio. An instance of Heads and shoulders patterns started showing on the 4H time frame signaling to us that a breakout might occur around Feb 11. If sellers break the support past our confirmation rectangle (Yellow w red outline), they will take over and form a new bearish pattern. If not, the Bulls will take over.

면책사항
해당 정보와 게시물은 금융, 투자, 트레이딩 또는 기타 유형의 조언이나 권장 사항으로 간주되지 않으며, 트레이딩뷰에서 제공하거나 보증하는 것이 아닙니다. 자세한 내용은 이용 약관을 참조하세요.
면책사항
해당 정보와 게시물은 금융, 투자, 트레이딩 또는 기타 유형의 조언이나 권장 사항으로 간주되지 않으며, 트레이딩뷰에서 제공하거나 보증하는 것이 아닙니다. 자세한 내용은 이용 약관을 참조하세요.