
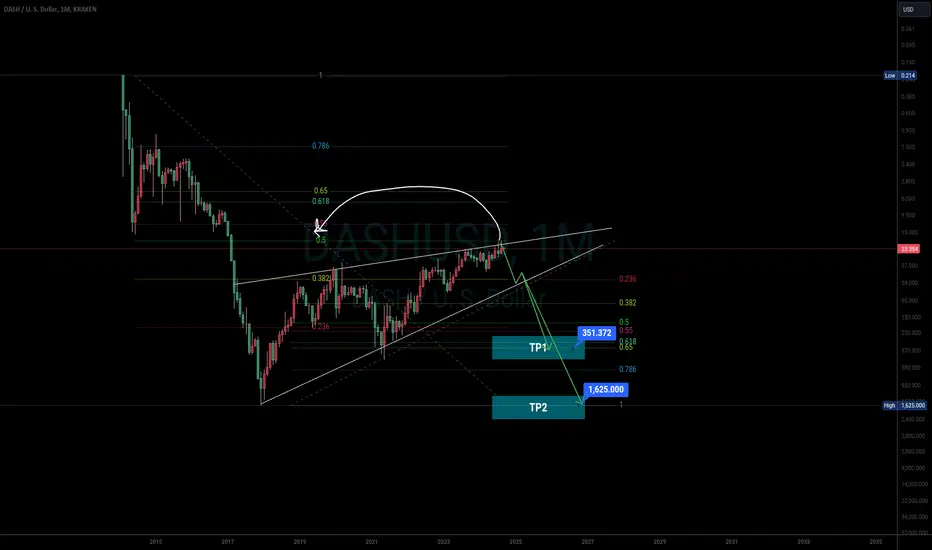
The chart speaks for itself. A textbook rising wedge.
This is NFA
This is NFA
액티브 트레이드
I expect the PA to accelerate to around $80 in December.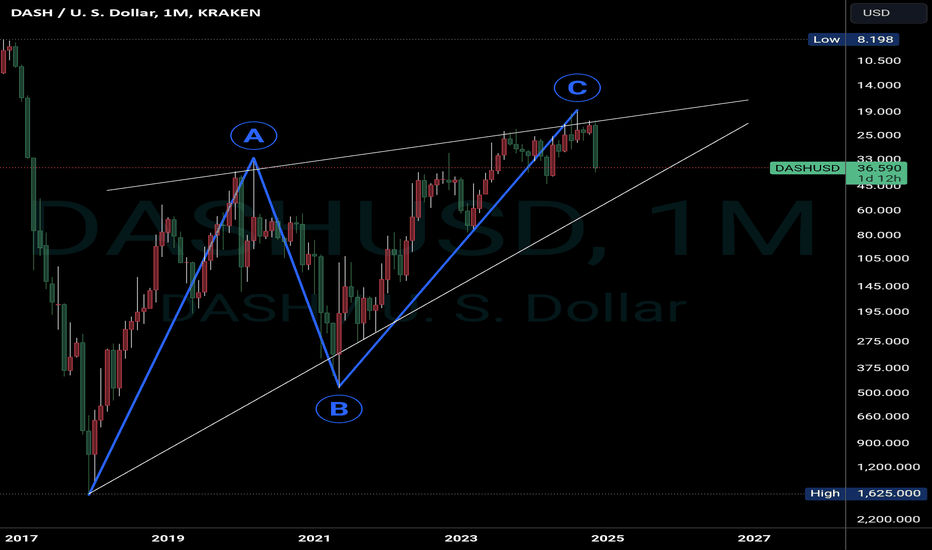
This is not investment advice.
노트
Tick tock 노트
I like how the rejection at the top of the falling wedge and recovery is quick. It didn't need to go down the bottom of the wedge to re-test it. This month's candle looks great! Once we're past this wedge it's show time!
노트
Here's a slightly different way of charting the falling wedge. It's valid too! The difference is that the B wave has a price action overthrow. Why is an overthrow? B typically retraces to 50% of wave A but here it's retraced to more than 65%. That's where I concluded there's an overthrow. It means the top of the wedge needs to come slightly down towards the real price action. What does this all mean?!? It means that right now we're not dealing with a rejection at the top of A re-test from the top down. In other words, we're well past the construct of the falling wedge and DASH is about to go parabolic starting this month!노트
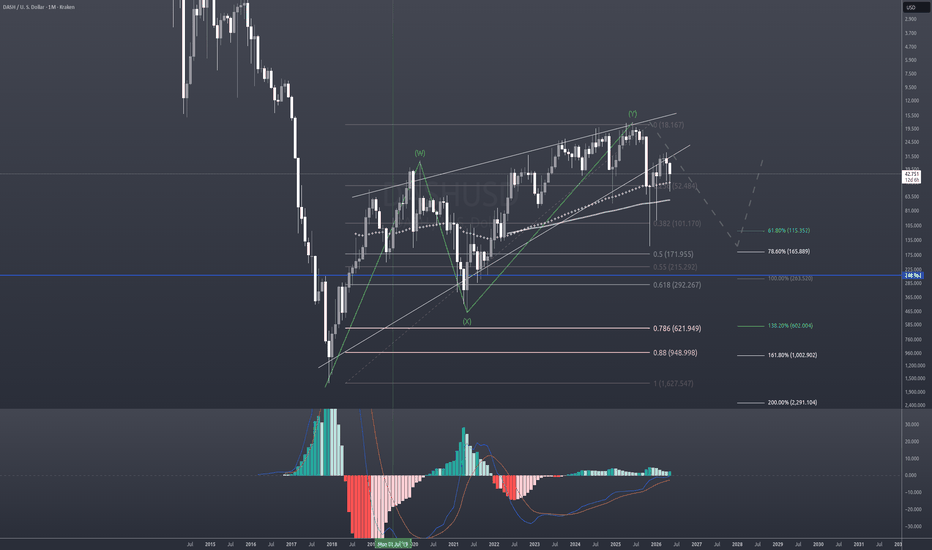

면책사항
해당 정보와 게시물은 금융, 투자, 트레이딩 또는 기타 유형의 조언이나 권장 사항으로 간주되지 않으며, 트레이딩뷰에서 제공하거나 보증하는 것이 아닙니다. 자세한 내용은 이용 약관을 참조하세요.
면책사항
해당 정보와 게시물은 금융, 투자, 트레이딩 또는 기타 유형의 조언이나 권장 사항으로 간주되지 않으며, 트레이딩뷰에서 제공하거나 보증하는 것이 아닙니다. 자세한 내용은 이용 약관을 참조하세요.