Long
Dash/Btc potential Head and Shoulder Pattern forming
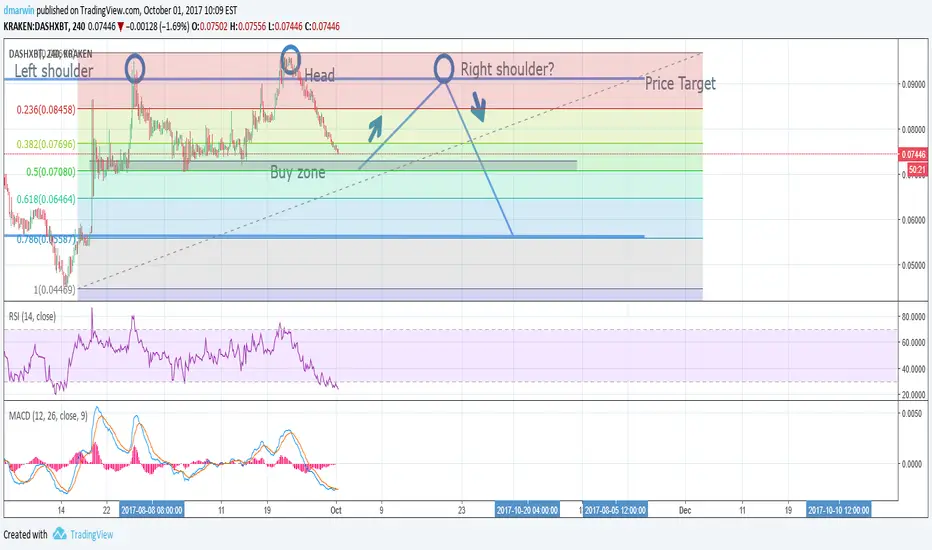
Dash/Btc is forming a potential head and shoulders pattern on the 4hr chart.
Rsi is heavily oversold and Macd is crossing which confirms a reversal to form the right shoulder.
Keep an eye on the daily chart before entering the market there is room for more down although the 0.50 fibinacci level is a strong support.
On the chart you find my buyzone, price target is located at the right shoulder. If it breaks the buyzone support is located at the 61.8 Fibonacci level.
Rsi is heavily oversold and Macd is crossing which confirms a reversal to form the right shoulder.
Keep an eye on the daily chart before entering the market there is room for more down although the 0.50 fibinacci level is a strong support.
On the chart you find my buyzone, price target is located at the right shoulder. If it breaks the buyzone support is located at the 61.8 Fibonacci level.
노트
I entered the long trade with a split order 50% at 0.0730 and 50% at 0.0710 Now let`s see how this goes.

면책사항
해당 정보와 게시물은 금융, 투자, 트레이딩 또는 기타 유형의 조언이나 권장 사항으로 간주되지 않으며, 트레이딩뷰에서 제공하거나 보증하는 것이 아닙니다. 자세한 내용은 이용 약관을 참조하세요.
면책사항
해당 정보와 게시물은 금융, 투자, 트레이딩 또는 기타 유형의 조언이나 권장 사항으로 간주되지 않으며, 트레이딩뷰에서 제공하거나 보증하는 것이 아닙니다. 자세한 내용은 이용 약관을 참조하세요.