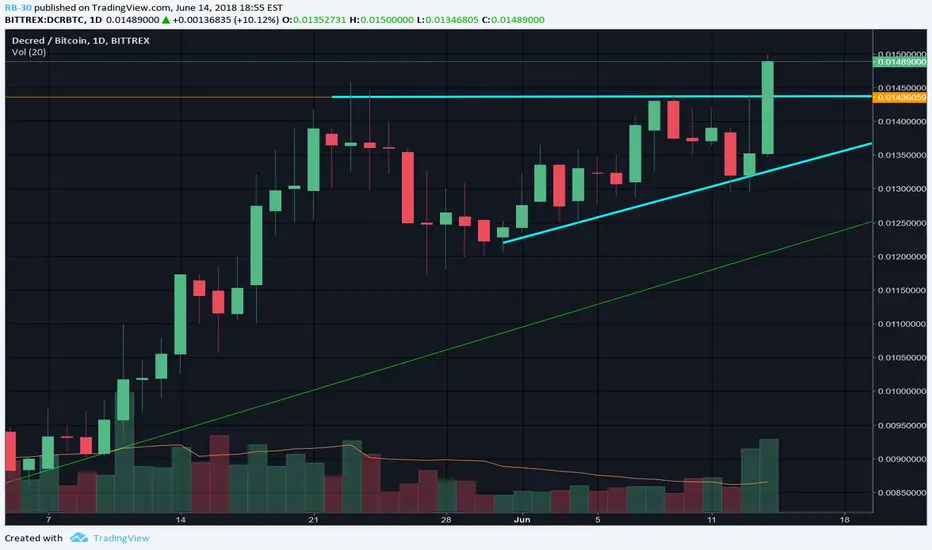
If you look at every daily chart, you will see that almost every coin has a bullish pattern sign. This doesn’t really imply that the downtrend is over or that there will be an uptrend. We only know that the bulls are declining the downward trend.
So Decred has been making an amazing uptrend, despite that almost every coin went down. The bears tried to push the price down by two times, but meanwhile you see that the bulls are squeezing the bears into the corner. This will lead to a continuation pattern, which is the ascending triangle.
The setup for this trade will be:
- The stop loss will be the support line of 0.01436059
- Target could be 0.01771530, but anything can happen on this way, that’s why I am going to update this chart until I am taking out my position.
ALWAYS keep in mind! That this is NOT an investment advice, but an analysis . You can do whatever you want with this information, so trade at your own risks!
So Decred has been making an amazing uptrend, despite that almost every coin went down. The bears tried to push the price down by two times, but meanwhile you see that the bulls are squeezing the bears into the corner. This will lead to a continuation pattern, which is the ascending triangle.
The setup for this trade will be:
- The stop loss will be the support line of 0.01436059
- Target could be 0.01771530, but anything can happen on this way, that’s why I am going to update this chart until I am taking out my position.
ALWAYS keep in mind! That this is NOT an investment advice, but an analysis . You can do whatever you want with this information, so trade at your own risks!
거래청산: 스탑 닿음
Yesterday the red candlestick already closes below the support line
면책사항
해당 정보와 게시물은 금융, 투자, 트레이딩 또는 기타 유형의 조언이나 권장 사항으로 간주되지 않으며, 트레이딩뷰에서 제공하거나 보증하는 것이 아닙니다. 자세한 내용은 이용 약관을 참조하세요.
면책사항
해당 정보와 게시물은 금융, 투자, 트레이딩 또는 기타 유형의 조언이나 권장 사항으로 간주되지 않으며, 트레이딩뷰에서 제공하거나 보증하는 것이 아닙니다. 자세한 내용은 이용 약관을 참조하세요.