
### Deep Industries Ltd. – Technical Analysis
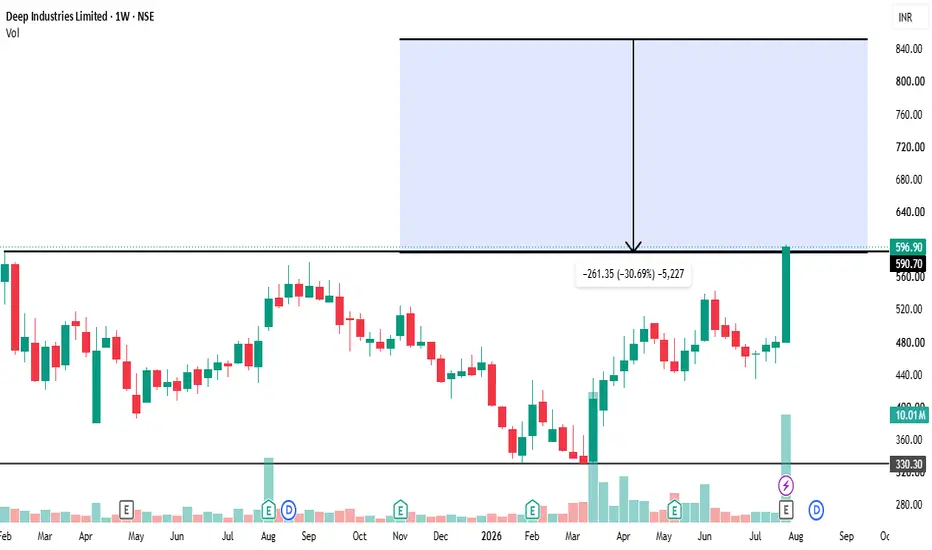
Deep Industries has delivered a strong breakout on the weekly chart after reclaiming the **₹590 resistance zone**, a level that had repeatedly capped the recent rally. The breakout is accompanied by a wide-range bullish candle and a sharp increase in volume, indicating renewed buying interest.
The overall trend remains positive, with the stock forming higher highs and higher lows since the March reversal. The latest move suggests that momentum is strengthening, and a sustained hold above the breakout level could extend the ongoing uptrend.
**Key Levels:**
* 🔹 **Breakout Zone:** ₹590
* 🔹 **Immediate Support:** ₹560–₹575
* 🔹 **Major Support:** ₹330
* 🎯 **Potential Targets:** ₹680 → ₹760 → ₹840
The breakout is technically significant, but after such a sharp weekly rally, some consolidation or a pullback towards the ₹590 zone would be a healthy development. If buyers defend this level on a weekly closing basis, the breakout structure remains valid and the stock could continue its upward trajectory.
⚠️ *This analysis is based purely on price action and chart structure. It is for educational purposes only and should not be considered investment advice.*
Deep Industries has delivered a strong breakout on the weekly chart after reclaiming the **₹590 resistance zone**, a level that had repeatedly capped the recent rally. The breakout is accompanied by a wide-range bullish candle and a sharp increase in volume, indicating renewed buying interest.
The overall trend remains positive, with the stock forming higher highs and higher lows since the March reversal. The latest move suggests that momentum is strengthening, and a sustained hold above the breakout level could extend the ongoing uptrend.
**Key Levels:**
* 🔹 **Breakout Zone:** ₹590
* 🔹 **Immediate Support:** ₹560–₹575
* 🔹 **Major Support:** ₹330
* 🎯 **Potential Targets:** ₹680 → ₹760 → ₹840
The breakout is technically significant, but after such a sharp weekly rally, some consolidation or a pullback towards the ₹590 zone would be a healthy development. If buyers defend this level on a weekly closing basis, the breakout structure remains valid and the stock could continue its upward trajectory.
⚠️ *This analysis is based purely on price action and chart structure. It is for educational purposes only and should not be considered investment advice.*

면책사항
해당 정보와 게시물은 금융, 투자, 트레이딩 또는 기타 유형의 조언이나 권장 사항으로 간주되지 않으며, 트레이딩뷰에서 제공하거나 보증하는 것이 아닙니다. 자세한 내용은 이용 약관을 참조하세요.
면책사항
해당 정보와 게시물은 금융, 투자, 트레이딩 또는 기타 유형의 조언이나 권장 사항으로 간주되지 않으며, 트레이딩뷰에서 제공하거나 보증하는 것이 아닙니다. 자세한 내용은 이용 약관을 참조하세요.