
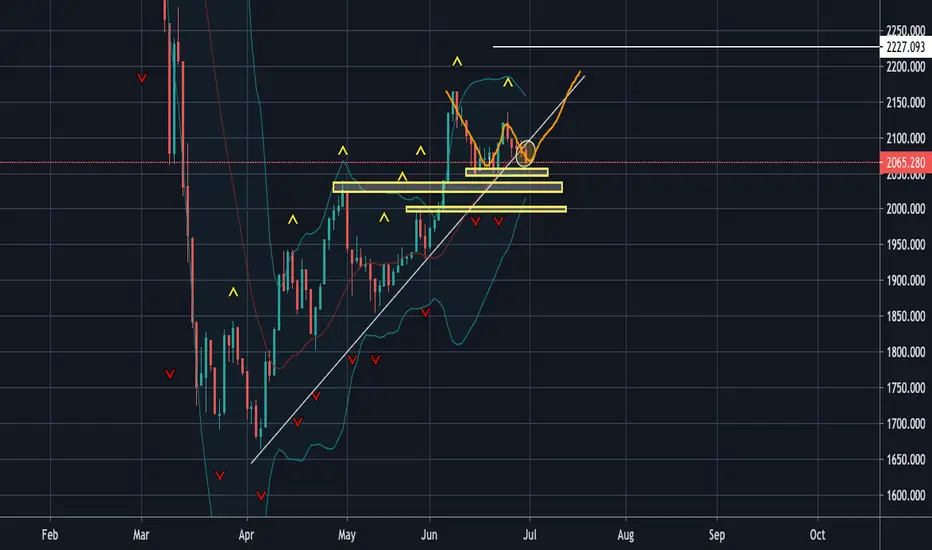
For the 5th day again it printed red candle and no sign of relief yet! There are 3 support areas marked in yellow boxes as you can see. First support at 2045 - 50 Second is 2030 to 35 and finally psychological support of 2000. In my opinion market have become weak, it made a doji right at the trendline and today it not only crossed but also retested and failed which is very very bearish. Technically we are still in up trend as we have not yet taken the lows out. There is a pattern which can be formed here and its not yet completed but i am presuming that there is a possibility to look at the market from a bull angel. This pattern usually occurs when the market is at the bottom or cannot break the resistance and in up trend it tries to break the resistance by going down consolidation and the up again, the pattern is called W pattern i have drawn on the chart for illustration. There is a possibility it can make a W pattern and resume the uptrend TILL the time its above 2050 level. I am bullish as long as it stays above 2050 levels.
Hit like & follow if you like my analysis.
Hit like & follow if you like my analysis.

면책사항
해당 정보와 게시물은 금융, 투자, 트레이딩 또는 기타 유형의 조언이나 권장 사항으로 간주되지 않으며, 트레이딩뷰에서 제공하거나 보증하는 것이 아닙니다. 자세한 내용은 이용 약관을 참조하세요.
면책사항
해당 정보와 게시물은 금융, 투자, 트레이딩 또는 기타 유형의 조언이나 권장 사항으로 간주되지 않으며, 트레이딩뷰에서 제공하거나 보증하는 것이 아닙니다. 자세한 내용은 이용 약관을 참조하세요.