
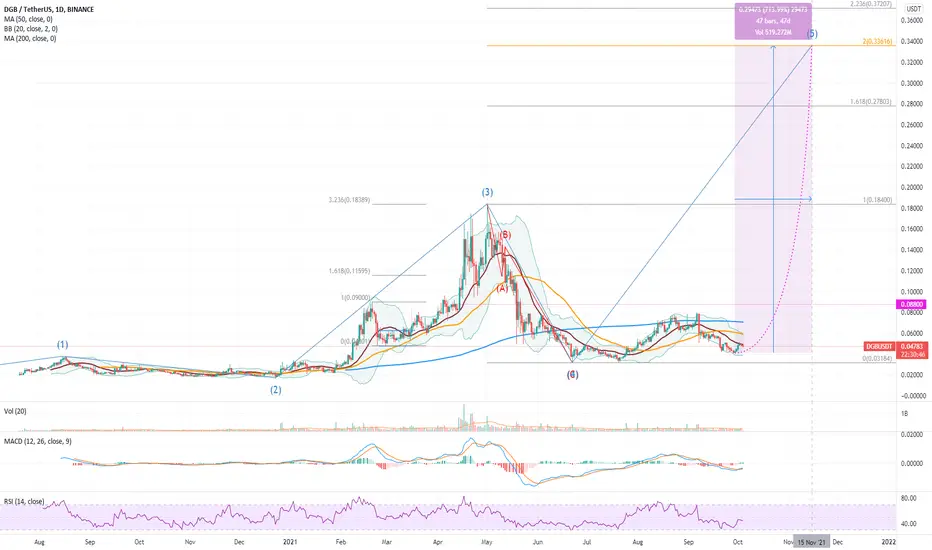
A review of the posture of Digibyte, following the completion of three corrections, printing three successively higher-lows.
In terms of Elliott Wave analysis, there are two interpretations:
Either case is bullish and is well supported by the MACD crossing bullish and the RSI sitting comfortably in neutral territory. Looking at the the Fibonacci projection of the correction on this standard scale chart and two targets present themselves:
Of course there are higher levels, but they will become exponentially less likely the longer DGB remains under $0.185.
What do you think? How high can DGB rally to complete this next impulse wave higher?
In terms of Elliott Wave analysis, there are two interpretations:
- DGB has now completed a Wave 4 and commenced a Wave 5; or
- DGB has completed a Wave 2 and just commenced a Wave 3.
Either case is bullish and is well supported by the MACD crossing bullish and the RSI sitting comfortably in neutral territory. Looking at the the Fibonacci projection of the correction on this standard scale chart and two targets present themselves:
- $0.278 at the 1.618 resistance line
- $0.336 at the 2.0 resistance line
Of course there are higher levels, but they will become exponentially less likely the longer DGB remains under $0.185.
What do you think? How high can DGB rally to complete this next impulse wave higher?

면책사항
해당 정보와 게시물은 금융, 투자, 트레이딩 또는 기타 유형의 조언이나 권장 사항으로 간주되지 않으며, 트레이딩뷰에서 제공하거나 보증하는 것이 아닙니다. 자세한 내용은 이용 약관을 참조하세요.
면책사항
해당 정보와 게시물은 금융, 투자, 트레이딩 또는 기타 유형의 조언이나 권장 사항으로 간주되지 않으며, 트레이딩뷰에서 제공하거나 보증하는 것이 아닙니다. 자세한 내용은 이용 약관을 참조하세요.