업데이트됨
digidao behaving nicely
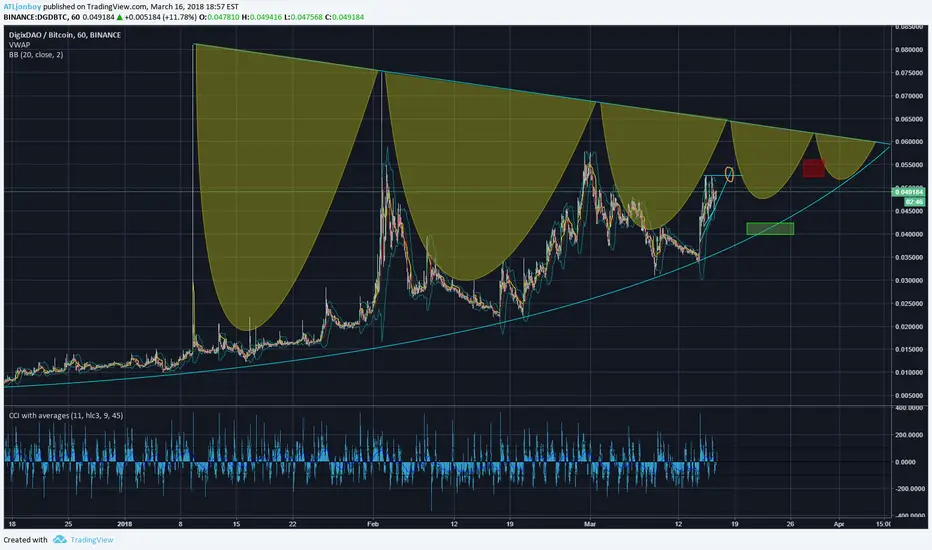
she has been bouncing perfectly on that bottom curve.
the big elipses i have hanging from the top trend line fit a nice volume pattern.
i predicted the last two curved paths and she is folding right in line.
watch this graph for the next week. if she keeps tracking as expected then the green box is the buy in and the red box is the sell target.
nice 20% trade for a week.
lets watch as she heads to that yellow circle and then plummets back to the blue curved bottom line......
노트
i added the forecaster tool... it says @ 35% trade over 6 days. not too shabby노트
looks like she ran out of steam and did not hit that first gold target.that decreases the next bounce to only 24% and moves the buy in date to midnight tonight!
노트
may even hit the line as early as 6:30 pm eastern.it could still be a 30% run over 5 days
노트
she gained a little steam and is back on track with that original green box...노트
i just put all my day trading money in at .04 with a stop limit at .038if it doesn't actually boop the line and shoots up like last time i don't want to miss it
노트
she usually exits the dip and into the green target right there at the .618 retracementlooks almost perfect.
노트
those two red lines are my stop trigger and the limit sell노트
seems like we have the market in a catch 22.btc may also see a 35% gain over the next week. ince this is a btc pair. if btc fires off first it should crash the price of dgd enough to trigger the stop loss and put the $ in btc for the ride up...
as dgd spikes, i will probably create a trailing stop loss so that my safe guards chase it up the incline.

면책사항
해당 정보와 게시물은 금융, 투자, 트레이딩 또는 기타 유형의 조언이나 권장 사항으로 간주되지 않으며, 트레이딩뷰에서 제공하거나 보증하는 것이 아닙니다. 자세한 내용은 이용 약관을 참조하세요.
면책사항
해당 정보와 게시물은 금융, 투자, 트레이딩 또는 기타 유형의 조언이나 권장 사항으로 간주되지 않으며, 트레이딩뷰에서 제공하거나 보증하는 것이 아닙니다. 자세한 내용은 이용 약관을 참조하세요.