
DIA (dow jones etf) - Support, Resistance, Trend - October 2021
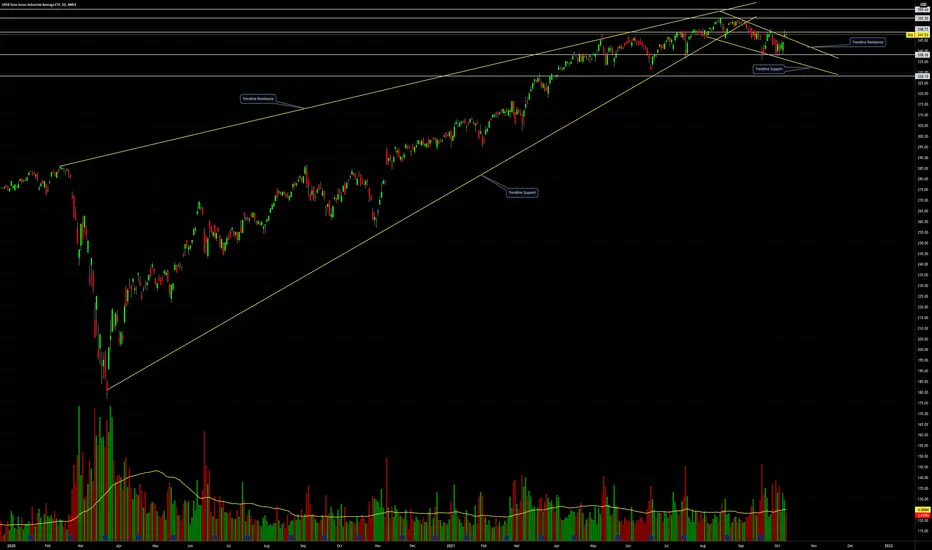
Dow Jones Index ETF has been in a daily downtrend since September 2021.
DIA price is currently above trendline resistance.
-Bullish scenario: price breaks and holds above $350 to $354.
-Bearish scenario: price falls below $344 to $338.
Resistance(s): $350, $352, $354, $355, $357, $359.
Support(s): $346, $344, $339, $335, $333, $331.
Q3 2021 earnings season is starting, and will likely be the catalyst for price volatility this month.
DIA price is currently above trendline resistance.
-Bullish scenario: price breaks and holds above $350 to $354.
-Bearish scenario: price falls below $344 to $338.
Resistance(s): $350, $352, $354, $355, $357, $359.
Support(s): $346, $344, $339, $335, $333, $331.
Q3 2021 earnings season is starting, and will likely be the catalyst for price volatility this month.

Follow Me on TradingView and Youtube.
Social Media links are in my profile.
Boost, comment, share to support.
All posts are not financial advice.
Social Media links are in my profile.
Boost, comment, share to support.
All posts are not financial advice.
면책사항
해당 정보와 게시물은 금융, 투자, 트레이딩 또는 기타 유형의 조언이나 권장 사항으로 간주되지 않으며, 트레이딩뷰에서 제공하거나 보증하는 것이 아닙니다. 자세한 내용은 이용 약관을 참조하세요.
Follow Me on TradingView and Youtube.
Social Media links are in my profile.
Boost, comment, share to support.
All posts are not financial advice.
Social Media links are in my profile.
Boost, comment, share to support.
All posts are not financial advice.
면책사항
해당 정보와 게시물은 금융, 투자, 트레이딩 또는 기타 유형의 조언이나 권장 사항으로 간주되지 않으며, 트레이딩뷰에서 제공하거나 보증하는 것이 아닙니다. 자세한 내용은 이용 약관을 참조하세요.