
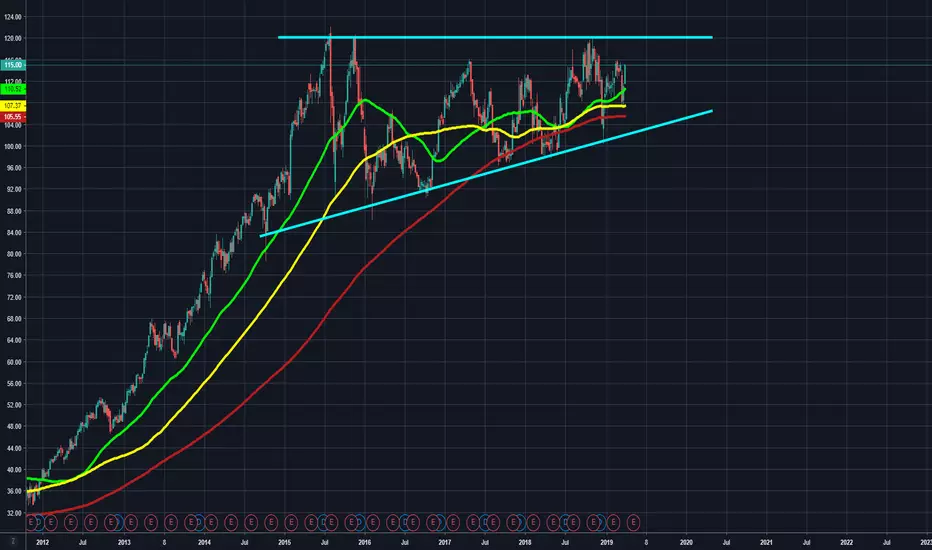
DIS (Disney) is currently within a weekly ascending triangle pattern. We've tested the flat-line of resistance around 120 three times, and we've tested the rising line of support about six times and buyers have shown up to defend it each and every time. It is now trading above the 50/100/200 weekly moving averages, and it appears it wants to test that flat resistance level around 120 again. I'm watching for a potential break up out of this ascending triangle pattern into a new price discovery phase.
Moving average guide (All Weekly for this post):
50 weekly moving average in Green.
100 weekly moving average in Yellow.
200 weekly moving average in Red.
-This is not financial advice. Always do your own research and own due-diligence before investing and trading, as for investing and trading comes with high amounts of risk. I am not liable for any incurred losses or financial distress.
Moving average guide (All Weekly for this post):
50 weekly moving average in Green.
100 weekly moving average in Yellow.
200 weekly moving average in Red.
-This is not financial advice. Always do your own research and own due-diligence before investing and trading, as for investing and trading comes with high amounts of risk. I am not liable for any incurred losses or financial distress.
노트
Broke through the flat line of resistance at 120, and we have now entered into a new price discovery phase: 
면책사항
해당 정보와 게시물은 금융, 투자, 트레이딩 또는 기타 유형의 조언이나 권장 사항으로 간주되지 않으며, 트레이딩뷰에서 제공하거나 보증하는 것이 아닙니다. 자세한 내용은 이용 약관을 참조하세요.
면책사항
해당 정보와 게시물은 금융, 투자, 트레이딩 또는 기타 유형의 조언이나 권장 사항으로 간주되지 않으며, 트레이딩뷰에서 제공하거나 보증하는 것이 아닙니다. 자세한 내용은 이용 약관을 참조하세요.