
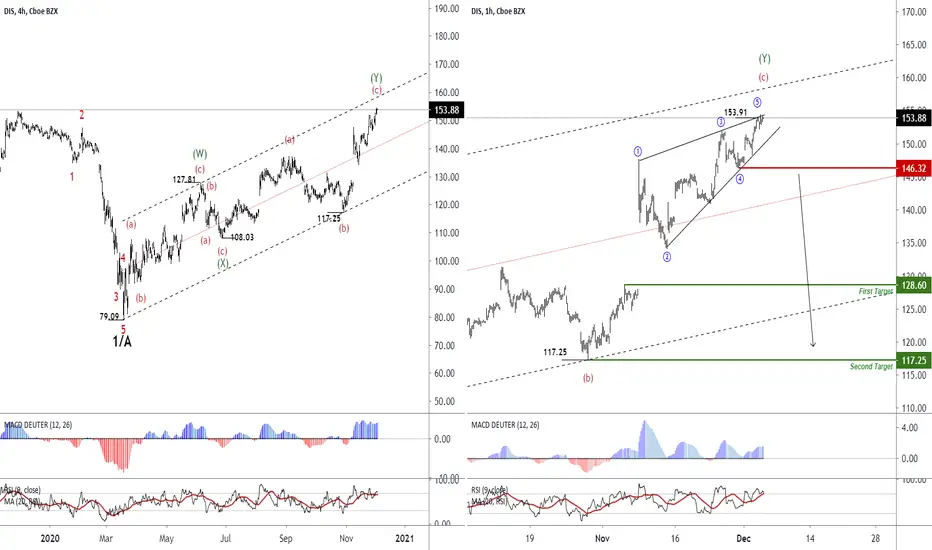
In the 240-minute chart, we have 5 descending waves, which have ended in the range of 79.09, in continuation, the correction of this downtrend is in the form of Double Zigzag, which has reached the range of $ 153.91. The Diagonal pattern has been formed in this range, of which the targets can be 128.60 and then $ 117.25.
In case the visualization of this analysis become true, the main pattern will be Expanded Flat and we can consider the expansion of the bearish trend up to the range of $ 79.09.
In case the visualization of this analysis become true, the main pattern will be Expanded Flat and we can consider the expansion of the bearish trend up to the range of $ 79.09.

면책사항
해당 정보와 게시물은 금융, 투자, 트레이딩 또는 기타 유형의 조언이나 권장 사항으로 간주되지 않으며, 트레이딩뷰에서 제공하거나 보증하는 것이 아닙니다. 자세한 내용은 이용 약관을 참조하세요.
면책사항
해당 정보와 게시물은 금융, 투자, 트레이딩 또는 기타 유형의 조언이나 권장 사항으로 간주되지 않으며, 트레이딩뷰에서 제공하거나 보증하는 것이 아닙니다. 자세한 내용은 이용 약관을 참조하세요.