
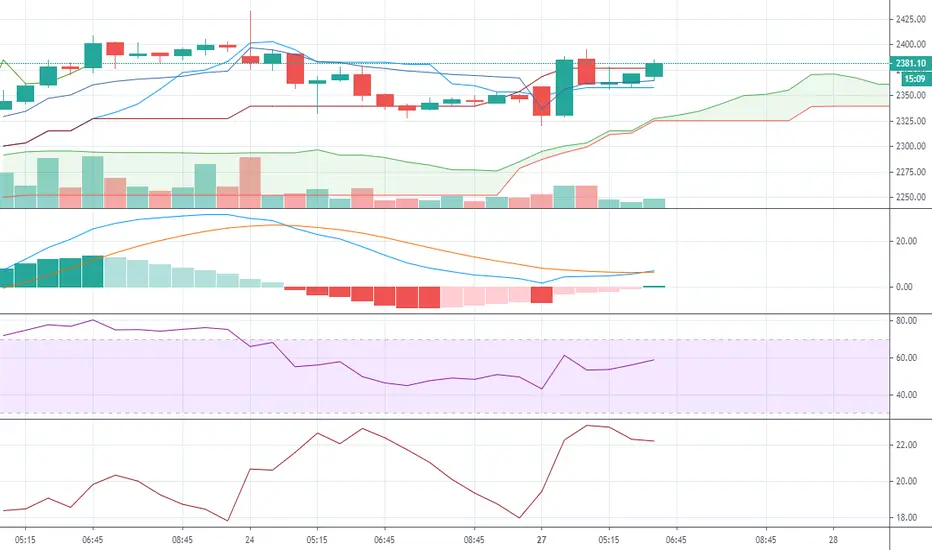
Intraday Cash Buy DIVISLAB @2364.00-2371 SL 2316.7 TGT 2452
It has good momentum with MACD cross over and 15 min chart ha TK cross over as well.
It has good momentum with MACD cross over and 15 min chart ha TK cross over as well.
액티브 트레이드
Those holding add more and those missed create fresh long. Divi’s Lab is one of the top-performing candidates from the pharma sector. In the ratio chart, the price has managed to breakout above the downsloping trendline indicating outperformance of Divi’s Lab in relation to Nifty Pharma Index. In the point & figure chart, the price has taken support at the upward sloping trendline and a fresh breakout buy signal is also triggered, suggesting bullish undertone. Go long in Divi’s Lab in the Rs 2,410-2,430 range with a stop loss at Rs 2,365 for targets of Rs 2,500 and Rs 2,560.거래청산: 타겟 닿음
First TGT hit but it looks good for more.
면책사항
해당 정보와 게시물은 금융, 투자, 트레이딩 또는 기타 유형의 조언이나 권장 사항으로 간주되지 않으며, 트레이딩뷰에서 제공하거나 보증하는 것이 아닙니다. 자세한 내용은 이용 약관을 참조하세요.
면책사항
해당 정보와 게시물은 금융, 투자, 트레이딩 또는 기타 유형의 조언이나 권장 사항으로 간주되지 않으며, 트레이딩뷰에서 제공하거나 보증하는 것이 아닙니다. 자세한 내용은 이용 약관을 참조하세요.