
Of course no one really knows the answer to that but this chart leads me to believe it is a definite possibility.
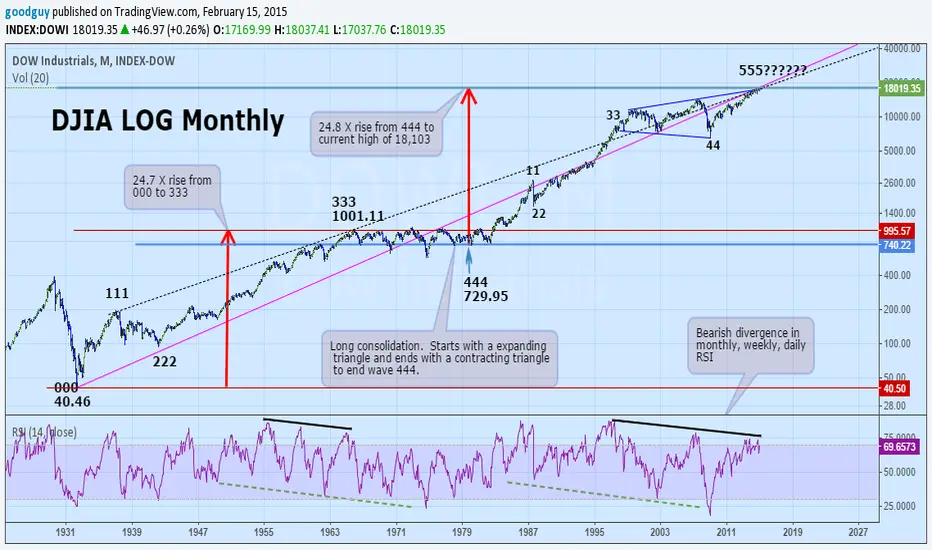
We have two very long term support-resistance lines and a third form 1998 that come together now. I counted out my view of EWTs 5 waves up. The 444 and the 44 waves are triangle consolidations as often occurs. Then I was surprised to see that the percent rise from 000 to 333 was almost identical to the rise from 444 to now. We have long term bearish divergences in the RSI on the monthly, weekly and daily charts. We should know in few months if all
of this has any merit. Take care. Have a good week ahead.
We have two very long term support-resistance lines and a third form 1998 that come together now. I counted out my view of EWTs 5 waves up. The 444 and the 44 waves are triangle consolidations as often occurs. Then I was surprised to see that the percent rise from 000 to 333 was almost identical to the rise from 444 to now. We have long term bearish divergences in the RSI on the monthly, weekly and daily charts. We should know in few months if all
of this has any merit. Take care. Have a good week ahead.

면책사항
해당 정보와 게시물은 금융, 투자, 트레이딩 또는 기타 유형의 조언이나 권장 사항으로 간주되지 않으며, 트레이딩뷰에서 제공하거나 보증하는 것이 아닙니다. 자세한 내용은 이용 약관을 참조하세요.
면책사항
해당 정보와 게시물은 금융, 투자, 트레이딩 또는 기타 유형의 조언이나 권장 사항으로 간주되지 않으며, 트레이딩뷰에서 제공하거나 보증하는 것이 아닙니다. 자세한 내용은 이용 약관을 참조하세요.