
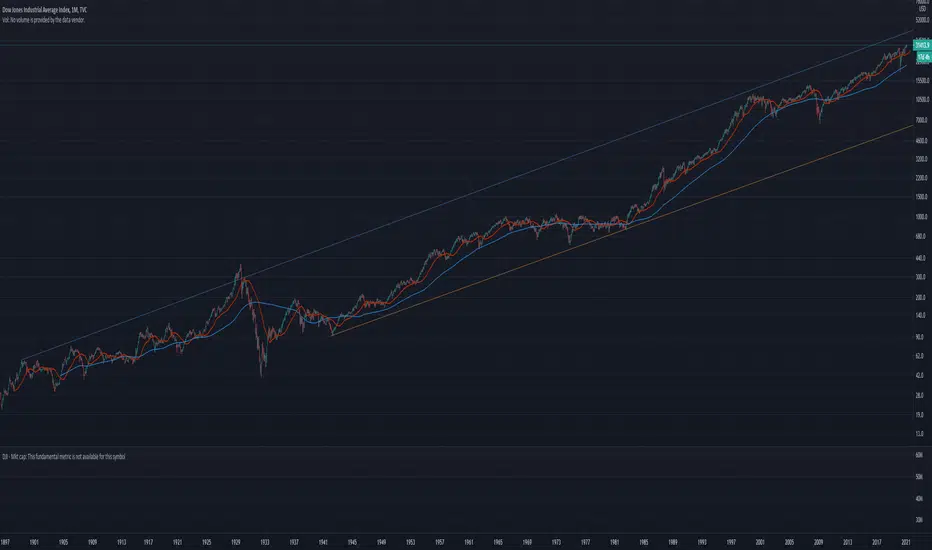
I keep hearing that stocks are in a bubble, but that just isn't true. People always look at charts in a linear mode, but this is not how math works. To get accurate prices and movement we MUST look at a logarithmic chart. When you do this for the Dow Jones average for the last century you clearly see we perhaps are a little inflated, but nowhere near Bubble territory. You want a Bubble? 1929 - now *that* was wildly over valued (with a subsequent epic crash). Now if in 2023 the Dow is above 45k? Then you can get back to me about how we might be in an asset Bubble. Until then I expect the trend to continue bullish.

면책사항
해당 정보와 게시물은 금융, 투자, 트레이딩 또는 기타 유형의 조언이나 권장 사항으로 간주되지 않으며, 트레이딩뷰에서 제공하거나 보증하는 것이 아닙니다. 자세한 내용은 이용 약관을 참조하세요.
면책사항
해당 정보와 게시물은 금융, 투자, 트레이딩 또는 기타 유형의 조언이나 권장 사항으로 간주되지 않으며, 트레이딩뷰에서 제공하거나 보증하는 것이 아닙니다. 자세한 내용은 이용 약관을 참조하세요.