
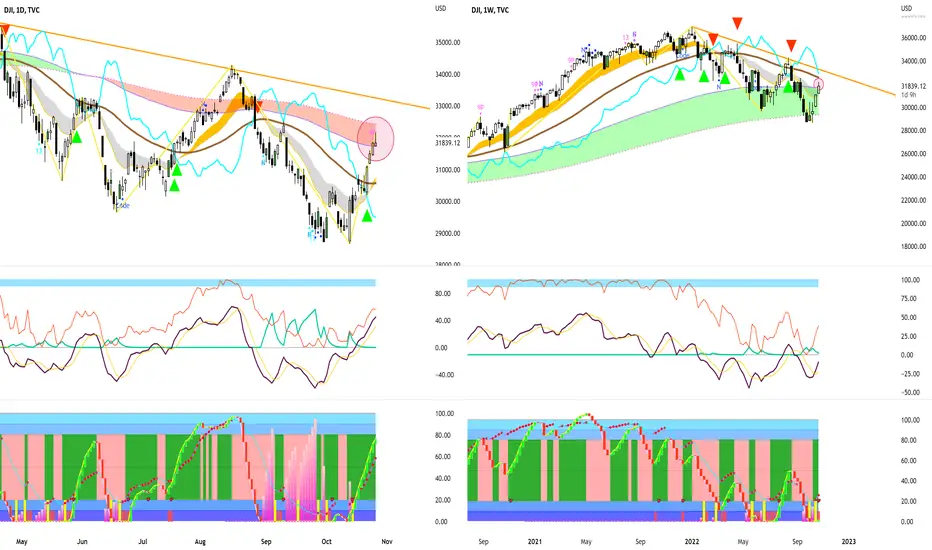
1. Youda_Potential, Fortune_TD, Fortune Banker trend, Fortune Crown stage:
Analysis on weekly chart
Youda Potential shows the midterm (brown line) is going downward, this is the potential resistance
Analysis on daily chart
Since the index potential be supported as shown in weekly chart, change the timeframe to daily chart for potential bottom catch opportunity.
Youda Potential shows the index hit the red color band, this is potential resistance her. Short term rebound should be stopped
Based on other indicator, predict the trend is changed from rebound to sideway, so a pull back/retrace might happen
2. Potential opportunity:
Shall wait the pull back at support, if the trend form second lower point on daily chart, that will be a good opportunity
Disclaimer : no recommendation of buy/sell, purely for TA learning and sharing.
Analysis on weekly chart
Youda Potential shows the midterm (brown line) is going downward, this is the potential resistance
Analysis on daily chart
Since the index potential be supported as shown in weekly chart, change the timeframe to daily chart for potential bottom catch opportunity.
Youda Potential shows the index hit the red color band, this is potential resistance her. Short term rebound should be stopped
Based on other indicator, predict the trend is changed from rebound to sideway, so a pull back/retrace might happen
2. Potential opportunity:
Shall wait the pull back at support, if the trend form second lower point on daily chart, that will be a good opportunity
Disclaimer : no recommendation of buy/sell, purely for TA learning and sharing.
노트
Closed some Long position, Min chart should have short term opportunity for Short position노트
nice, still hold some Long term position노트
Clear all Long position yesterday, waiting for the next entry point, hit the down trend line
관련 발행물
면책사항
해당 정보와 게시물은 금융, 투자, 트레이딩 또는 기타 유형의 조언이나 권장 사항으로 간주되지 않으며, 트레이딩뷰에서 제공하거나 보증하는 것이 아닙니다. 자세한 내용은 이용 약관을 참조하세요.
면책사항
해당 정보와 게시물은 금융, 투자, 트레이딩 또는 기타 유형의 조언이나 권장 사항으로 간주되지 않으며, 트레이딩뷰에서 제공하거나 보증하는 것이 아닙니다. 자세한 내용은 이용 약관을 참조하세요.