
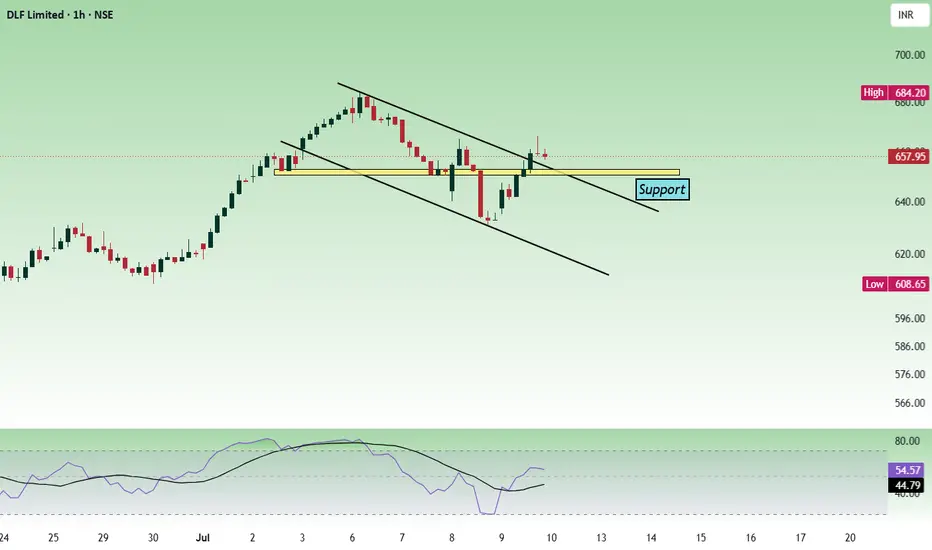
There are different patterns in the chart. in lower and higher time frames. In the lower time frame, the price is moving in a descending channel and in the daily time frame, the price is moving in an ascending channel.

Considering all these facts, if the price shows bullish strength at the 650 zone, the price can move up.
Buy above 654 with the stop loss of 648 for the targets 659, 666, 672, 680 and 688.
The price can test the upper trendline of the channel in the daily time frame.
Always do your analysis before taking any trade.
Considering all these facts, if the price shows bullish strength at the 650 zone, the price can move up.
Buy above 654 with the stop loss of 648 for the targets 659, 666, 672, 680 and 688.
The price can test the upper trendline of the channel in the daily time frame.
Always do your analysis before taking any trade.
액티브 트레이드
Long. T3 done. 거래청산: 타겟 닿음
Done. The price is moving towards the upper trendline of the channel. 
Role I play here : Moderator. Follow me in telegram to trade better. t.me/Analysis4Newbie Contact information : tradingplan4u@gmail.com
면책사항
해당 정보와 게시물은 금융, 투자, 트레이딩 또는 기타 유형의 조언이나 권장 사항으로 간주되지 않으며, 트레이딩뷰에서 제공하거나 보증하는 것이 아닙니다. 자세한 내용은 이용 약관을 참조하세요.
Role I play here : Moderator. Follow me in telegram to trade better. t.me/Analysis4Newbie Contact information : tradingplan4u@gmail.com
면책사항
해당 정보와 게시물은 금융, 투자, 트레이딩 또는 기타 유형의 조언이나 권장 사항으로 간주되지 않으며, 트레이딩뷰에서 제공하거나 보증하는 것이 아닙니다. 자세한 내용은 이용 약관을 참조하세요.