
I saw a really interesting chart from MartyBanks about DoDo, I've linked it in the related ideas.
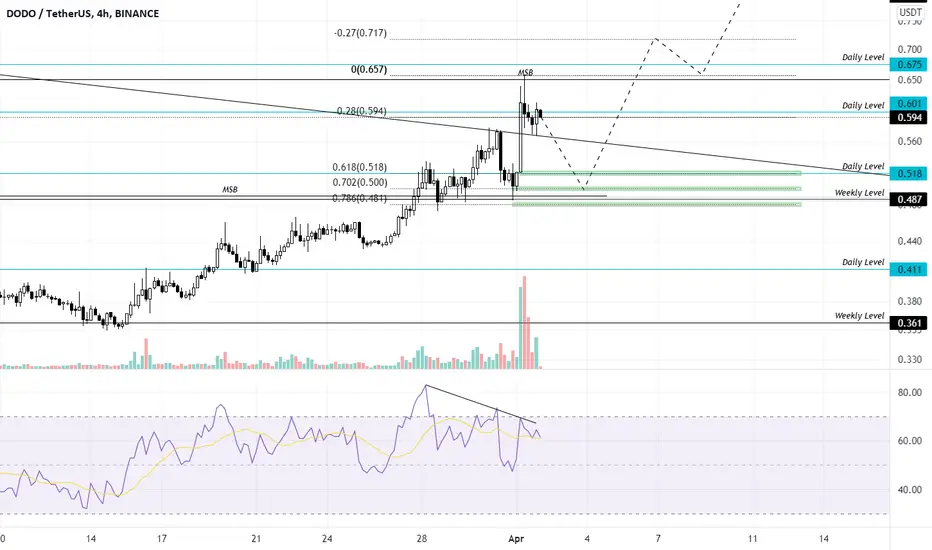
So I decided to look back and chart DoDo. After a massive dump it found support on the weekly level and more recently bouncing from daily support.

From there we had a clear market structure break on the daily. You could make a case and say that we actually had two market structure breaks on the daily timeframe and formed a daily order block at the .489 level. The 9day ema cross of the 21day ema also shows signs of bullishness.
I'm now waiting for a retest to enter. Targets are .518, .500 and .481.
I recommend watching the idea linked to get a better grasp of the situation.
So I decided to look back and chart DoDo. After a massive dump it found support on the weekly level and more recently bouncing from daily support.
From there we had a clear market structure break on the daily. You could make a case and say that we actually had two market structure breaks on the daily timeframe and formed a daily order block at the .489 level. The 9day ema cross of the 21day ema also shows signs of bullishness.
I'm now waiting for a retest to enter. Targets are .518, .500 and .481.
I recommend watching the idea linked to get a better grasp of the situation.

관련 발행물
면책사항
해당 정보와 게시물은 금융, 투자, 트레이딩 또는 기타 유형의 조언이나 권장 사항으로 간주되지 않으며, 트레이딩뷰에서 제공하거나 보증하는 것이 아닙니다. 자세한 내용은 이용 약관을 참조하세요.
면책사항
해당 정보와 게시물은 금융, 투자, 트레이딩 또는 기타 유형의 조언이나 권장 사항으로 간주되지 않으며, 트레이딩뷰에서 제공하거나 보증하는 것이 아닙니다. 자세한 내용은 이용 약관을 참조하세요.