
*** ***
For this particular analysis on DOGEwe are using the DOGEUSDT symbol on the Phemex exchange.
*** ***
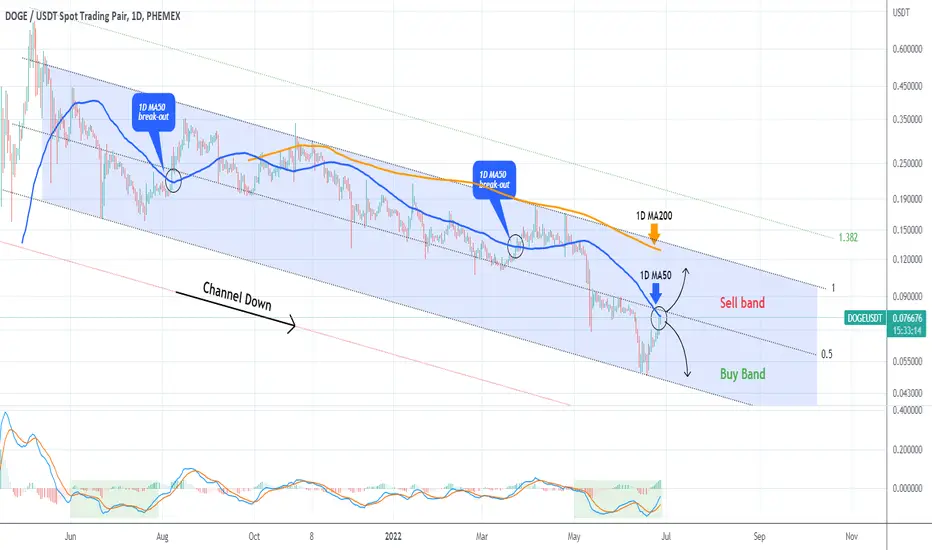
The idea is on the 1D time-frame where Doge has been trading within a Channel Down since mid-May 2021. The median of the Channel plays a key role on this pattern as it distinguishes the formation into a Buy and a Sell Band, with the former being the bottom part where buying is a more optimal choice and the latter being the top part where selling is advised. Remarkably, the price has been mostly trading in the Sell Band but since May 11 it dropped aggressively and stayed in the Buy Band.
The recent 1 week rally though has brought the price just below the Channel's median and right on a critical 1D MA50 (blue trend-line) test. The 1D MA50 is important because every time the price broke above it, Doge reached as high as the 1D MA200 (orange trend-line). The 1D MA200 is currently just below the Channel's top (Lower Highs trend-line) so keep an eye for a candle closing above it, which will be a break-out buy signal near the 1D MA200. The 1D MACD is printing a similar sequence and the June-July 2021 pattern which was the previous Lower Low of the Channel and after breaking the 1D MA50, it almost hit its top.
--------------------------------------------------------------------------------------------------------
Please like, subscribe and share your ideas and charts with the community!
--------------------------------------------------------------------------------------------------------
For this particular analysis on DOGEwe are using the DOGEUSDT symbol on the Phemex exchange.
*** ***
The idea is on the 1D time-frame where Doge has been trading within a Channel Down since mid-May 2021. The median of the Channel plays a key role on this pattern as it distinguishes the formation into a Buy and a Sell Band, with the former being the bottom part where buying is a more optimal choice and the latter being the top part where selling is advised. Remarkably, the price has been mostly trading in the Sell Band but since May 11 it dropped aggressively and stayed in the Buy Band.
The recent 1 week rally though has brought the price just below the Channel's median and right on a critical 1D MA50 (blue trend-line) test. The 1D MA50 is important because every time the price broke above it, Doge reached as high as the 1D MA200 (orange trend-line). The 1D MA200 is currently just below the Channel's top (Lower Highs trend-line) so keep an eye for a candle closing above it, which will be a break-out buy signal near the 1D MA200. The 1D MACD is printing a similar sequence and the June-July 2021 pattern which was the previous Lower Low of the Channel and after breaking the 1D MA50, it almost hit its top.
--------------------------------------------------------------------------------------------------------
Please like, subscribe and share your ideas and charts with the community!
--------------------------------------------------------------------------------------------------------

I trade Crypto, Forex, Indices & Commodities on PrimeXBT — all from one account with TradingView charts 👉 tradingshot.short.gy/PrimeXBT
I also use TradeNation for fixed spreads & zero commission 👉 tradingshot.short.gy/Tradenation
I also use TradeNation for fixed spreads & zero commission 👉 tradingshot.short.gy/Tradenation
면책사항
해당 정보와 게시물은 금융, 투자, 트레이딩 또는 기타 유형의 조언이나 권장 사항으로 간주되지 않으며, 트레이딩뷰에서 제공하거나 보증하는 것이 아닙니다. 자세한 내용은 이용 약관을 참조하세요.
I trade Crypto, Forex, Indices & Commodities on PrimeXBT — all from one account with TradingView charts 👉 tradingshot.short.gy/PrimeXBT
I also use TradeNation for fixed spreads & zero commission 👉 tradingshot.short.gy/Tradenation
I also use TradeNation for fixed spreads & zero commission 👉 tradingshot.short.gy/Tradenation
면책사항
해당 정보와 게시물은 금융, 투자, 트레이딩 또는 기타 유형의 조언이나 권장 사항으로 간주되지 않으며, 트레이딩뷰에서 제공하거나 보증하는 것이 아닙니다. 자세한 내용은 이용 약관을 참조하세요.