
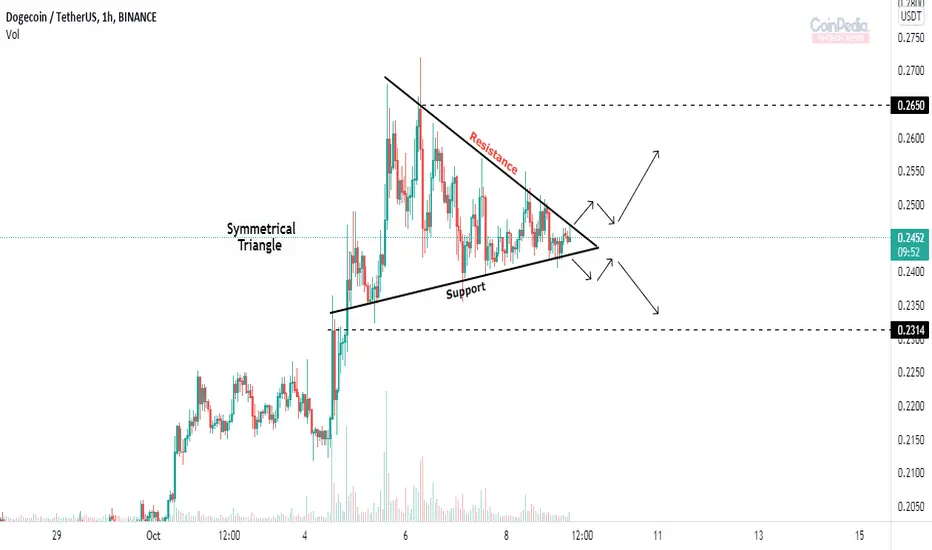
* Dogecoin in 1H time frame forms a Symmetrical triangle.
* Symmetrical triangle occurs when the price consolidates between two trend-lines (ascending trend-line and descending trend-line) sloping towards each other, the price is forced to break either side of the pattern.
* If Dogecoin breaks either side of the pattern we can see a healthy move.
* Symmetrical triangle occurs when the price consolidates between two trend-lines (ascending trend-line and descending trend-line) sloping towards each other, the price is forced to break either side of the pattern.
* If Dogecoin breaks either side of the pattern we can see a healthy move.

🚨 FREE Crypto Signals — Don't Get Left Behind!
📲 Live buy/sell alerts before the crowd:
👉 t.me/coinpedia_markets
📊 Real-time market moves + trending coins:
👉 markets.coinpedia.org/
⚡Join now — the next move won't wait FOR YOU.
📲 Live buy/sell alerts before the crowd:
👉 t.me/coinpedia_markets
📊 Real-time market moves + trending coins:
👉 markets.coinpedia.org/
⚡Join now — the next move won't wait FOR YOU.
면책사항
해당 정보와 게시물은 금융, 투자, 트레이딩 또는 기타 유형의 조언이나 권장 사항으로 간주되지 않으며, 트레이딩뷰에서 제공하거나 보증하는 것이 아닙니다. 자세한 내용은 이용 약관을 참조하세요.
🚨 FREE Crypto Signals — Don't Get Left Behind!
📲 Live buy/sell alerts before the crowd:
👉 t.me/coinpedia_markets
📊 Real-time market moves + trending coins:
👉 markets.coinpedia.org/
⚡Join now — the next move won't wait FOR YOU.
📲 Live buy/sell alerts before the crowd:
👉 t.me/coinpedia_markets
📊 Real-time market moves + trending coins:
👉 markets.coinpedia.org/
⚡Join now — the next move won't wait FOR YOU.
면책사항
해당 정보와 게시물은 금융, 투자, 트레이딩 또는 기타 유형의 조언이나 권장 사항으로 간주되지 않으며, 트레이딩뷰에서 제공하거나 보증하는 것이 아닙니다. 자세한 내용은 이용 약관을 참조하세요.