
hi Traders,
This trading idea is based on the Daily chart for the DOT/BTC pair, identifying a classic continuation pattern after a period of prolonged weakness.
DOT/BTC bullish outlook supports the bullish trading idea for DOT/USDT that we published today:

Anyway, let's focus on DOT/BTC now:
*Key Technical Observations
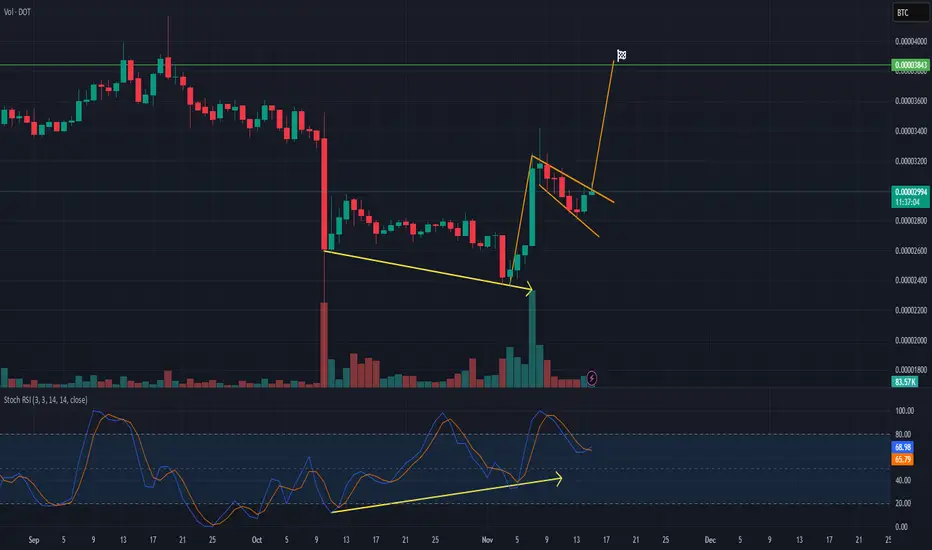
Bull Flag Continuation Pattern: The price action is currently consolidating within a clearly defined Bull Flag pattern (highlighted by the orange descending channel). This is a strong, corrective pause following a sharp, vertical impulse move (the flagpole) that began in early November 2025. This pattern statistically favors a breakout to the upside.
*Bullish Divergence Confirmation: The preceding strong move was likely fueled by a Bullish Divergence (highlighted by the yellow lines). As the price made lower lows (descending yellow line in the price panel), the Stochastic RSI made higher lows (ascending yellow line in the indicator panel). This indicates that the momentum weakness was not confirmed by the speed indicator, signaling that a major bottom was being formed before the vertical rally.
*Current Momentum (Stoch RSI): The Stochastic RSI is currently in the neutral-to-overbought zone (above 65), but the lines are beginning to curve slightly downward. This suggests the corrective consolidation within the flag is healthy and gives the indicator room to reset before the next move up.
*Trading Strategy
Trade Bias: Long (Buy)
*Entry Trigger: Confirmation of a breakout above the upper trendline of the Bull Flag pattern. A daily candle closing above this resistance is ideal.
*Target: The primary price target is derived by projecting the height of the preceding flagpole upwards from the point of the breakout. This targets the 0.00003843 BTC level (marked by the green horizontal line), aligning with previous swing highs.
Invalidation/Stop-Loss: A Daily candle close below the lower trendline of the Bull Flag would invalidate the pattern. A stop-loss should be placed safely below this level.
*Summary
The setup for DOT/BTC is highly bullish, driven by the combination of an underlying Bullish Divergence signaling a bottom reversal, followed by a Bull Flag pattern indicating an imminent continuation of the rally. Traders should wait for the confirmed breakout to enter the next leg up towards the target zone.
This trading idea is based on the Daily chart for the DOT/BTC pair, identifying a classic continuation pattern after a period of prolonged weakness.
DOT/BTC bullish outlook supports the bullish trading idea for DOT/USDT that we published today:
Anyway, let's focus on DOT/BTC now:
*Key Technical Observations
Bull Flag Continuation Pattern: The price action is currently consolidating within a clearly defined Bull Flag pattern (highlighted by the orange descending channel). This is a strong, corrective pause following a sharp, vertical impulse move (the flagpole) that began in early November 2025. This pattern statistically favors a breakout to the upside.
*Bullish Divergence Confirmation: The preceding strong move was likely fueled by a Bullish Divergence (highlighted by the yellow lines). As the price made lower lows (descending yellow line in the price panel), the Stochastic RSI made higher lows (ascending yellow line in the indicator panel). This indicates that the momentum weakness was not confirmed by the speed indicator, signaling that a major bottom was being formed before the vertical rally.
*Current Momentum (Stoch RSI): The Stochastic RSI is currently in the neutral-to-overbought zone (above 65), but the lines are beginning to curve slightly downward. This suggests the corrective consolidation within the flag is healthy and gives the indicator room to reset before the next move up.
*Trading Strategy
Trade Bias: Long (Buy)
*Entry Trigger: Confirmation of a breakout above the upper trendline of the Bull Flag pattern. A daily candle closing above this resistance is ideal.
*Target: The primary price target is derived by projecting the height of the preceding flagpole upwards from the point of the breakout. This targets the 0.00003843 BTC level (marked by the green horizontal line), aligning with previous swing highs.
Invalidation/Stop-Loss: A Daily candle close below the lower trendline of the Bull Flag would invalidate the pattern. A stop-loss should be placed safely below this level.
*Summary
The setup for DOT/BTC is highly bullish, driven by the combination of an underlying Bullish Divergence signaling a bottom reversal, followed by a Bull Flag pattern indicating an imminent continuation of the rally. Traders should wait for the confirmed breakout to enter the next leg up towards the target zone.

💥 Free signals and ideas ➡ t.me/vfinvestment
면책사항
해당 정보와 게시물은 금융, 투자, 트레이딩 또는 기타 유형의 조언이나 권장 사항으로 간주되지 않으며, 트레이딩뷰에서 제공하거나 보증하는 것이 아닙니다. 자세한 내용은 이용 약관을 참조하세요.
💥 Free signals and ideas ➡ t.me/vfinvestment
면책사항
해당 정보와 게시물은 금융, 투자, 트레이딩 또는 기타 유형의 조언이나 권장 사항으로 간주되지 않으며, 트레이딩뷰에서 제공하거나 보증하는 것이 아닙니다. 자세한 내용은 이용 약관을 참조하세요.