
Hello all, and thanks for supporting my channel.
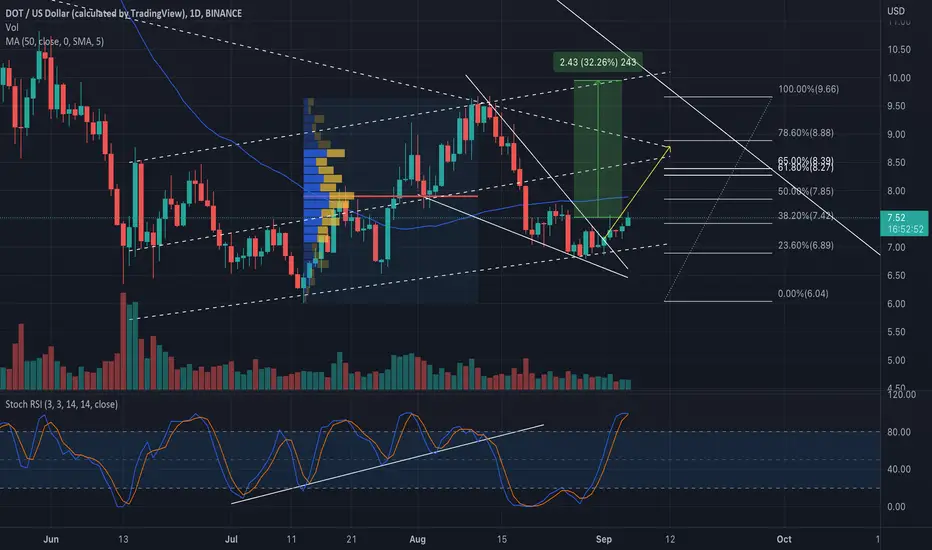
Looking at DOTUSD on the daily timeframe, we see a formation of a falling wedge pattern which has a bullish price target at $8.90. This price also corresponds with the 78% fibonacci retracement level and is also the top of the weekly candle formation.
On the daily timeframe we are also trading inside the ascending channel which has support level sitting at $7 and resistance level at $10. For this channel, the Fixed Range Volume Profile provides a point of control at around $7.85 which is also the 50% Fibonacci retracement level.
On the 4hr timeframe, DOT broke bullish out of the $7.50 price, and is currently retesting this price for support.
As such, if the price of DOT can clear the $8 mark, we can retest the top of the channel at $10. This is approximately 30% move to the upside from the current point.
Thanks for reading, and stay tuned. Enjoy.
Looking at DOTUSD on the daily timeframe, we see a formation of a falling wedge pattern which has a bullish price target at $8.90. This price also corresponds with the 78% fibonacci retracement level and is also the top of the weekly candle formation.
On the daily timeframe we are also trading inside the ascending channel which has support level sitting at $7 and resistance level at $10. For this channel, the Fixed Range Volume Profile provides a point of control at around $7.85 which is also the 50% Fibonacci retracement level.
On the 4hr timeframe, DOT broke bullish out of the $7.50 price, and is currently retesting this price for support.
As such, if the price of DOT can clear the $8 mark, we can retest the top of the channel at $10. This is approximately 30% move to the upside from the current point.
Thanks for reading, and stay tuned. Enjoy.

면책사항
해당 정보와 게시물은 금융, 투자, 트레이딩 또는 기타 유형의 조언이나 권장 사항으로 간주되지 않으며, 트레이딩뷰에서 제공하거나 보증하는 것이 아닙니다. 자세한 내용은 이용 약관을 참조하세요.
면책사항
해당 정보와 게시물은 금융, 투자, 트레이딩 또는 기타 유형의 조언이나 권장 사항으로 간주되지 않으며, 트레이딩뷰에서 제공하거나 보증하는 것이 아닙니다. 자세한 내용은 이용 약관을 참조하세요.