
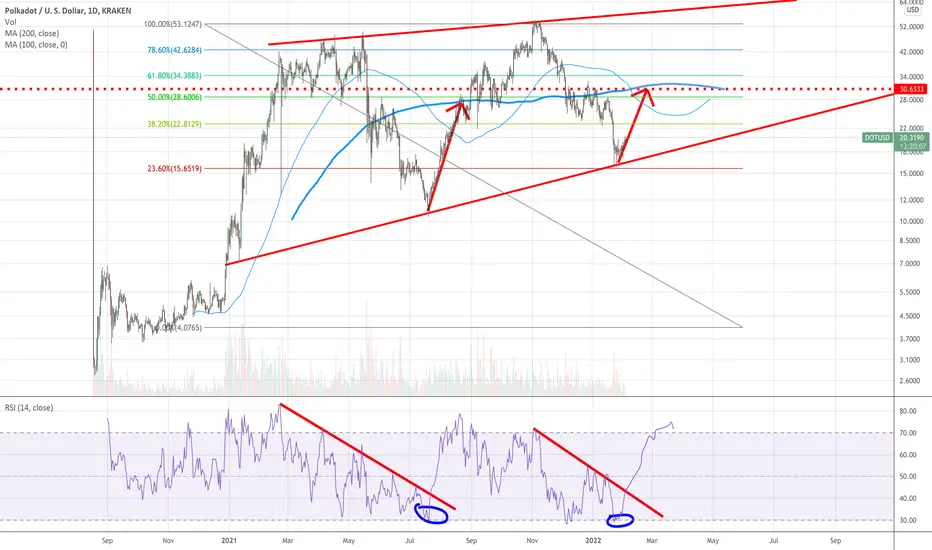
Polkadot forming a long-TF ascending triangle on Daily
2nd bottom & re-test of the ascending triangle seams to be confirmed by:
- RSI bottomed and about to breakout (same levels as mid-july 2021 selloff)
- Current overall market reaction
- 23.6 Fib level acting once again as nice support
- MA 100 & 200 seem to re-create a similar pattern as during mid-july 2021 selloff
Potential 50% gains until EO Feb 2022.
Entry at 19-20$
Stop loss at 17.90$
--> Target 28-31$
Happy Trading!
2nd bottom & re-test of the ascending triangle seams to be confirmed by:
- RSI bottomed and about to breakout (same levels as mid-july 2021 selloff)
- Current overall market reaction
- 23.6 Fib level acting once again as nice support
- MA 100 & 200 seem to re-create a similar pattern as during mid-july 2021 selloff
Potential 50% gains until EO Feb 2022.
Entry at 19-20$
Stop loss at 17.90$
--> Target 28-31$
Happy Trading!
액티브 트레이드
Idea Is still Valid거래청산: 스탑 닿음

면책사항
해당 정보와 게시물은 금융, 투자, 트레이딩 또는 기타 유형의 조언이나 권장 사항으로 간주되지 않으며, 트레이딩뷰에서 제공하거나 보증하는 것이 아닙니다. 자세한 내용은 이용 약관을 참조하세요.
면책사항
해당 정보와 게시물은 금융, 투자, 트레이딩 또는 기타 유형의 조언이나 권장 사항으로 간주되지 않으며, 트레이딩뷰에서 제공하거나 보증하는 것이 아닙니다. 자세한 내용은 이용 약관을 참조하세요.